Initial load performance for React developers: investigative deep dive
Exploring Core Web Vitals, performance dev tools, what initial load performance is, which metrics measure it, and how cache control and different networking conditions influence it.
Community-supported translations : پارسی
Nadia Makarevich

These days, with AI-driven code generation booming, the importance of writing React code is shrinking. Anyone and anything can write apps in React now. But writing code has always been just one part of the puzzle. We still need to deploy our apps somewhere, show them to users, make them robust, make them fast, and do a million other things. No AI can take over those. Not yet, at least.
So, let's focus on making apps fast today. And to do that, we need to step outside of React for a while. Because before making something fast, we first need to know what "fast" is, how to measure it, and what can influence this "fastness".
Spoiler alert: there will be no React in this article other than the study project. Today is all about fundamental stuff: how to use performance tools, an intro to Core Web Vitals, Chrome performance panel, what initial load performance is, which metrics measure it, and how cache control and different networking conditions influence it.
Introducing initial load performance metrics
What happens when I open my browser and try to navigate to my favorite website? I type "http://www.my-website.com" into the address bar, the browser sends a GET request to the server, and receives an HTML page in return.

The time it takes to do that is known as "Time To First Byte" (TTFB): the time between when the request is sent and when the result starts arriving. After the HTML is received, the browser now has to convert this HTML into a usable website as soon as possible.
It starts by rendering on the screen what is known as the "critical path": the minimal and most important content that can be shown to the user.
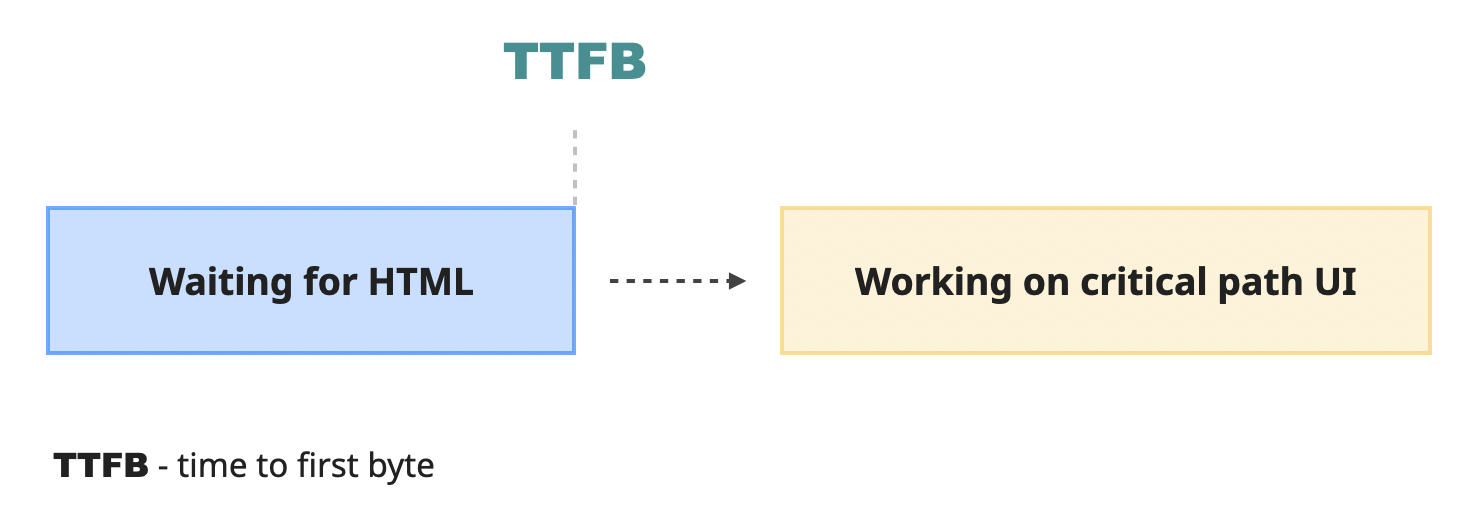
What exactly should be in the critical path is a complicated question. Ideally, everything so that the user sees the complete experience right away. But also - nothing, since it needs to be as fast as possible since it's a "critical" path. Both at the same time are impossible, so there needs to be a compromise.
The compromise looks like this. The browser assumes that to build the "critical path," it absolutely needs at least those types of resources:
- The initial HTML that it receives from the server - to construct the actual DOM elements from which the experience is built.
- The important CSS files that style those initial elements - otherwise, if it proceeded without waiting for them, the user would see a weird "flash" of unstyled content at the very beginning.
- The critical JavaScript files that modify the layout synchronously.
The first one (HTML) the browser gets in the initial request from the server. It starts parsing it, and while doing so extracts links to the CSS and JS files it needs to complete the "critical path". It then sends the requests to get them from the server, waits until they are downloaded, processes them, combines all of this together, and at some point at the end, paints the "critical path" pixels on the screen.
Since the browser can't complete the initial rendering without those critical resources, they are known as "render-blocking resources". Not all CSS and JS resources are render-blocking, of course. It's usually only:
- Most of the CSS, whether it's inline or via
<link>tag. - JavaScript resources in the
<head>tag that are notasyncordeferred.
The overall process of rendering the "critical path" looks something like this (roughly):
- The browser starts parsing the initial HTML
- While doing so, it extracts links to CSS and JS resources from the
<head>tag. - Then, it kicks off the downloading process and waits for blocking resources to finish the download.
- While waiting, it continues with processing HTML if possible.
- After all the critical resources are received, they are processed as well.
- And finally, it finishes whatever needs to be done and paints the actual pixels of the interface.
This point in time is what we know as First Paint (FP). It's the very first time the user has an opportunity to see something on the screen. Whether it will happen or not depends on the HTML the server sent. If there is something meaningful there, like a text or an image, then this point will also be when the First Contentful Paint (FCP) happened. If the HTML is just an empty div, then the FCP will happen later.
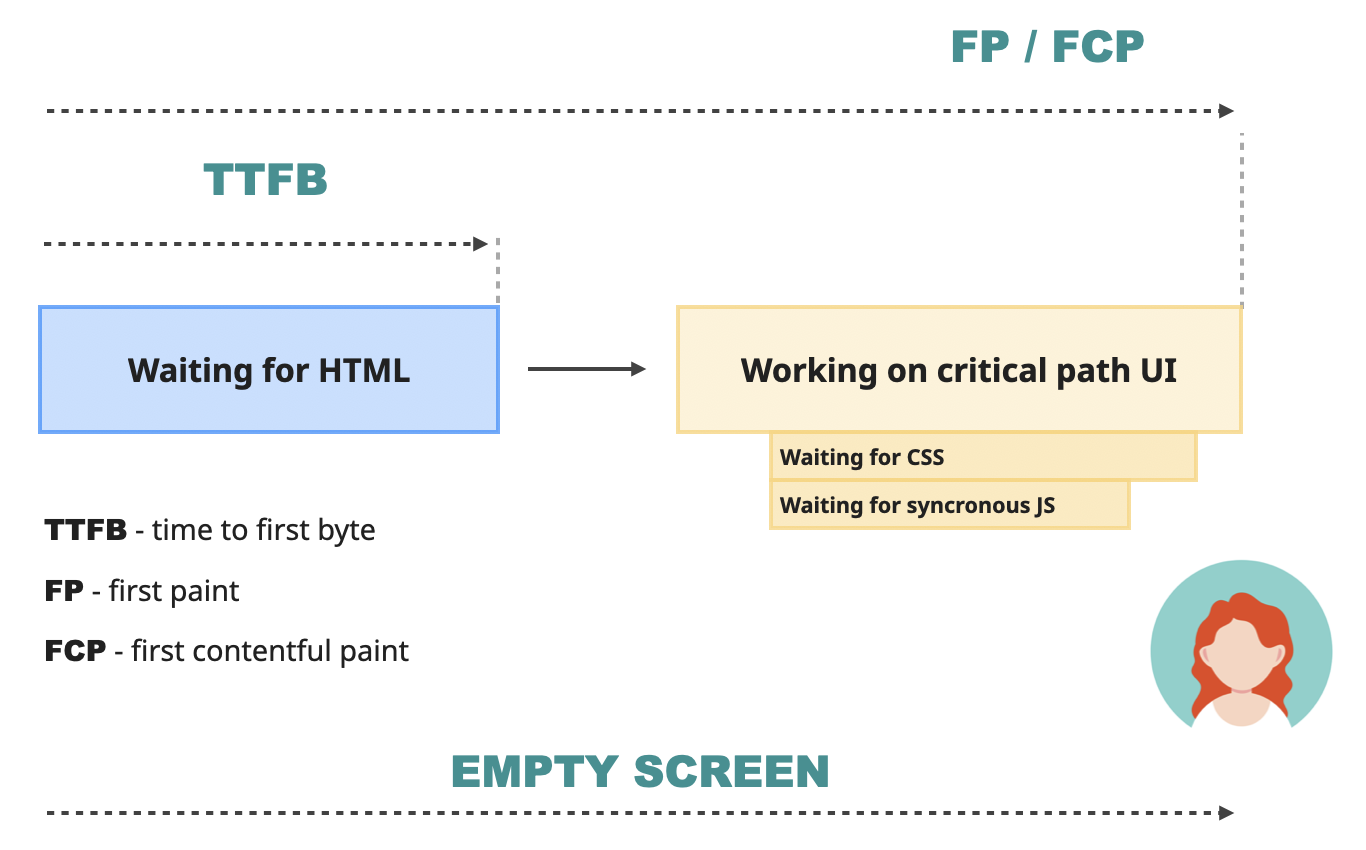
First Contentful Paint (FCP) is one of the most important performance metrics since it measures perceived initial load. Basically, it is the user's first impression of how fast your website is.
Until this moment, the users are just biting their nails while staring at the blank screen. According to Google, a good FCP number is below 1.8 seconds. After that, the users will start losing interest in what your website can offer and might start leaving.
However, FCP is not perfect. If the website starts its load with a spinner or some loading screen, the FCP metric will represent that. But it's highly unlikely that the user navigated to the website just to check out the fancy loading screen. Most of the time, they want to access the content.
For this, the browser needs to finish the work it started. It waits for the rest of the non-blocking JavaScript, executes it, applies changes that originated from it to the DOM on the screen, downloads images, and otherwise polishes the user experience.
Somewhere during this process is when the Largest Contentful Paint (LCP) time happens. Instead of the very first element, like FCP, it represents the main content area on the page - the largest text, image, or video visible in the viewport. According to Google, this number ideally should be below 2.5 seconds. More than that, and the users will think the website is slow.
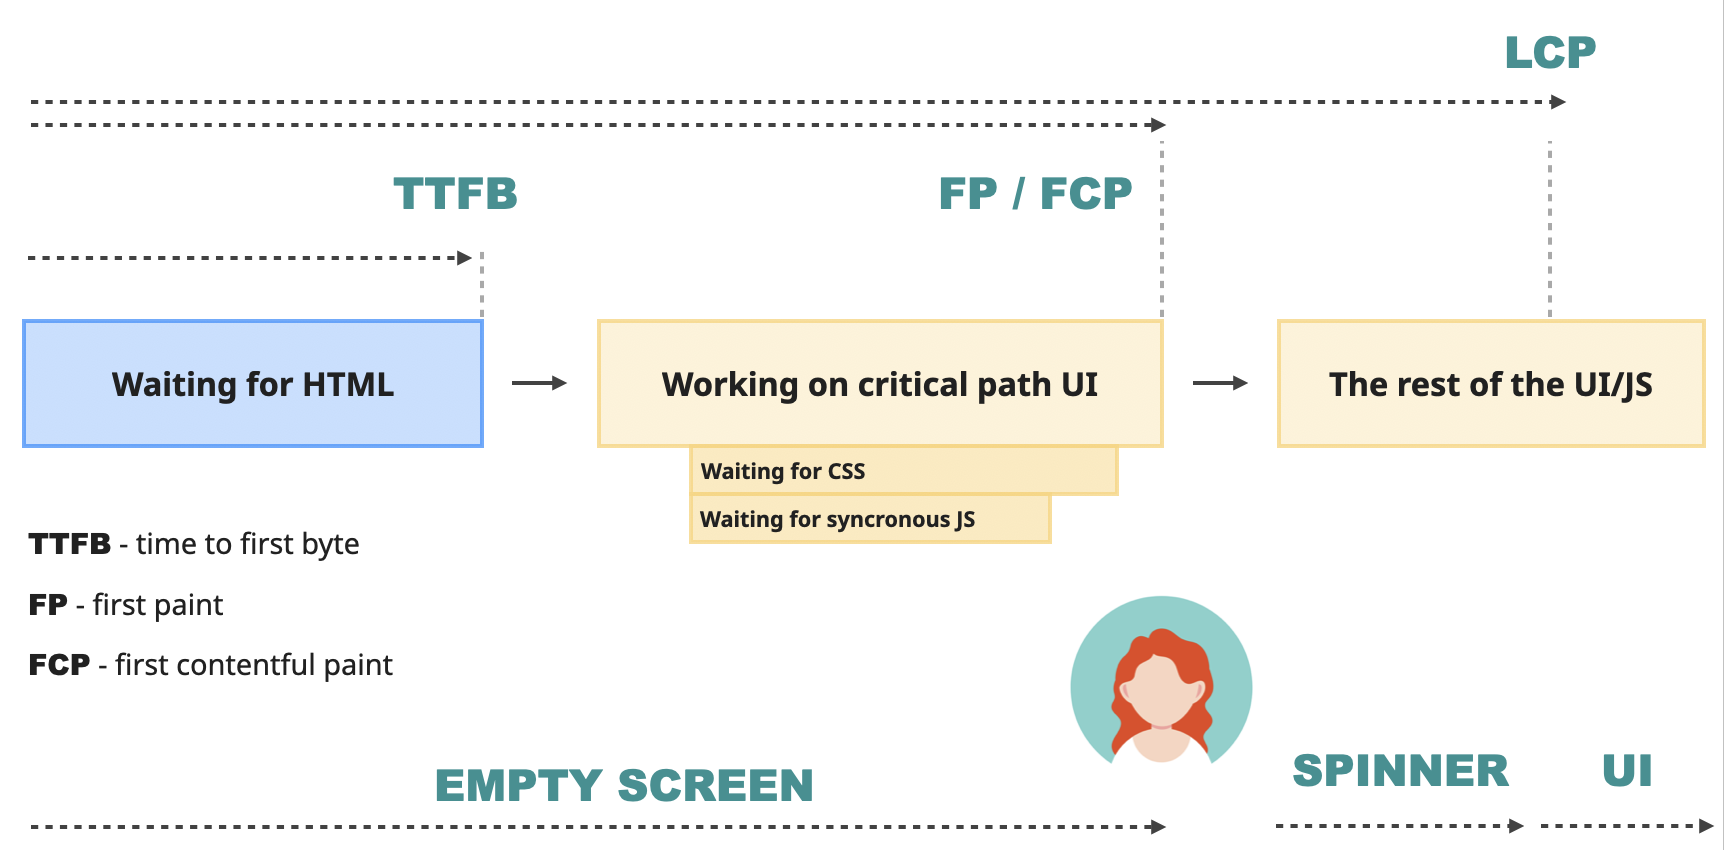
All of those metrics are part of Google's Web Vitals - a set of metrics that represent user experience on a page. LCP is one of the three Core Web Vitals - three metrics that represent different parts of the user experience. LCP is responsible for the loading performance.
Those metrics can be measured by Lighthouse. Lighthouse is a Google performance tool that is integrated into the Chrome DevTools and can also be run via a shell script, web interface, or node module. You can use it in the form of a node module to run it inside your build and detect regressions before they hit production. Use the integrated DevTools version for local debugging and testing. And the web version to check out the performance of competitors.
Overview of the performance DevTools
All of the above is a very brief and simplified explanation of the process. But it's already a lot of abbreviations and theory to make a person's head spin. For me personally, reading something like this is of no use. I instantly forget everything unless I can see it in action and play around with it with my own hands.
For this particular topic, I find the easiest way to fully understand the concepts is to simulate different scenarios on a semi-real page and see how they change the outcome. So let's do exactly that before doing even more theory (and there is so much more!).
Setting up the project
You can do all of the simulations below on your own project if you wish - the results should be more or less the same. For a more controlled and simplified environment, however, I would recommend using a study project I prepared for this article. You can access it here: https://github.com/developerway/initial-load-performance
Start by installing all the dependencies:
npm install
Building the project:
npm run build
And starting the server:
npm run start
You should see a nice dashboard page at "http://localhost:3000".
Exploring the necessary DevTools
Open the website you want to analyze in Chrome and open Chrome DevTools. Find the "Performance" and "Lighthouse" panels there and move them closer together. We'll need both of them.
Also, before doing anything else in this article, make sure you have the "Disable cache" checkbox enabled. It should be in the Network panel at the very top.
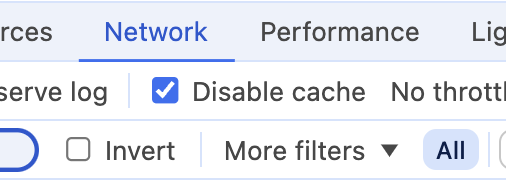
This is so that we can emulate first-time visitors - people who've never been to our website before and don't have any resources cached by the browser yet.
Exploring the Lighthouse panel
Open the Lighthouse panel now. You should see a few settings there and the "Analyze page load" button.
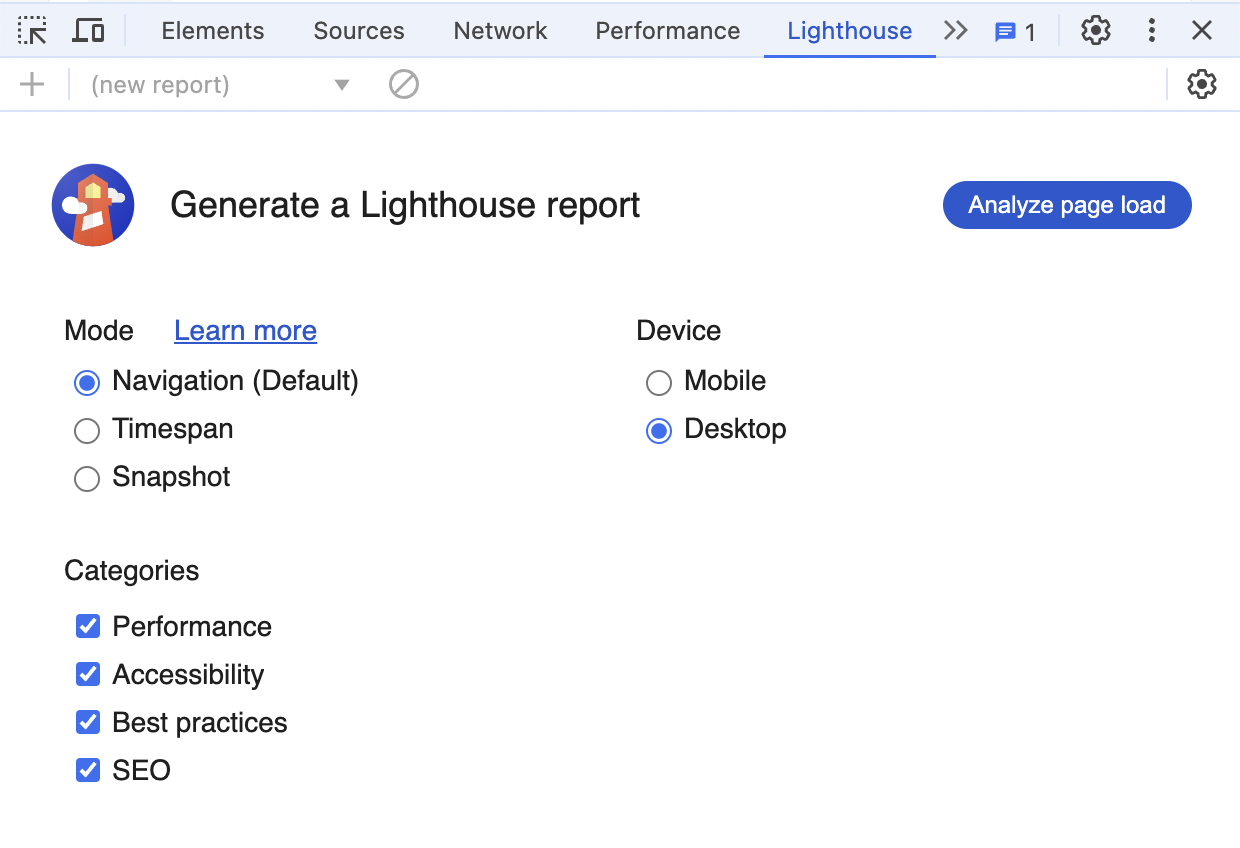
"Navigation" mode is the one we're interested in for this section - it will run a detailed analysis of the page's initial load. The report will give you scores like this:
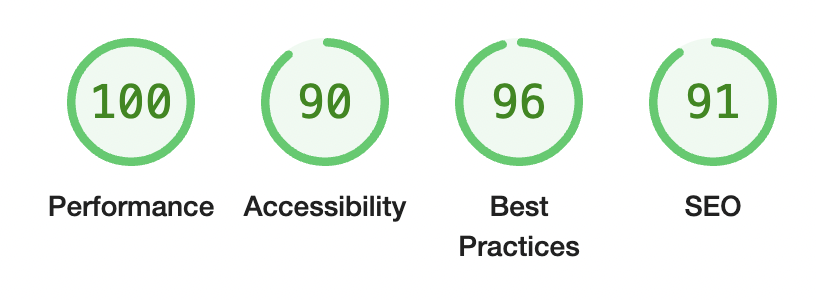
The local performance is perfect, no surprise there - everything always "works on my machine".
There will also be metrics like this:
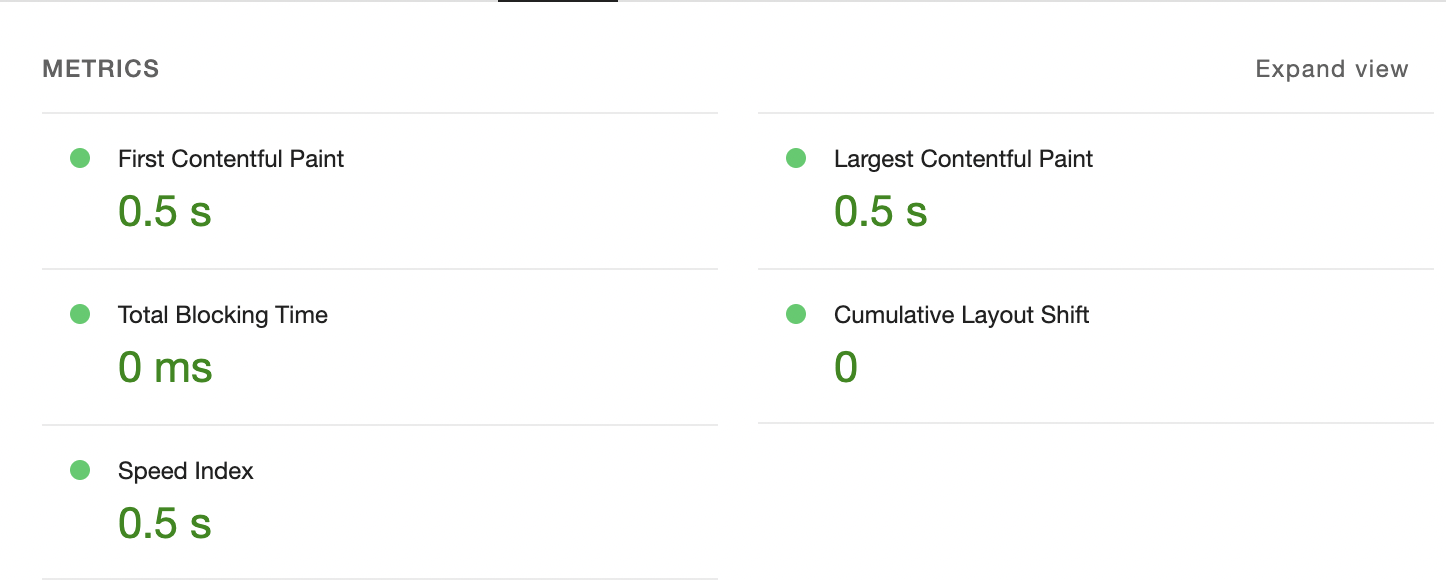
The FCP and LCP values that we need for this article are right at the top.
Below, you'll see a list of suggestions that can help you improve your scores.

Every suggestion can be expanded, and you'll find more detailed information there, and sometimes links that explain that particular topic. Not all of them can be actioned, but it's an incredible tool to get started on performance and learn more about different things that can improve it. It's possible to spend hours just reading through those reports and the related links.
Lighthouse, however, only gives surface-level information and doesn't allow you to simulate different scenarios like a slow network or low CPU. It's just a great entry point and an awesome tool to track the performance changes over time. To dig deeper into what is happening, we need the "Performance" panel.
Exploring the Performance panel
When first loaded, the Performance panel should look something like this:
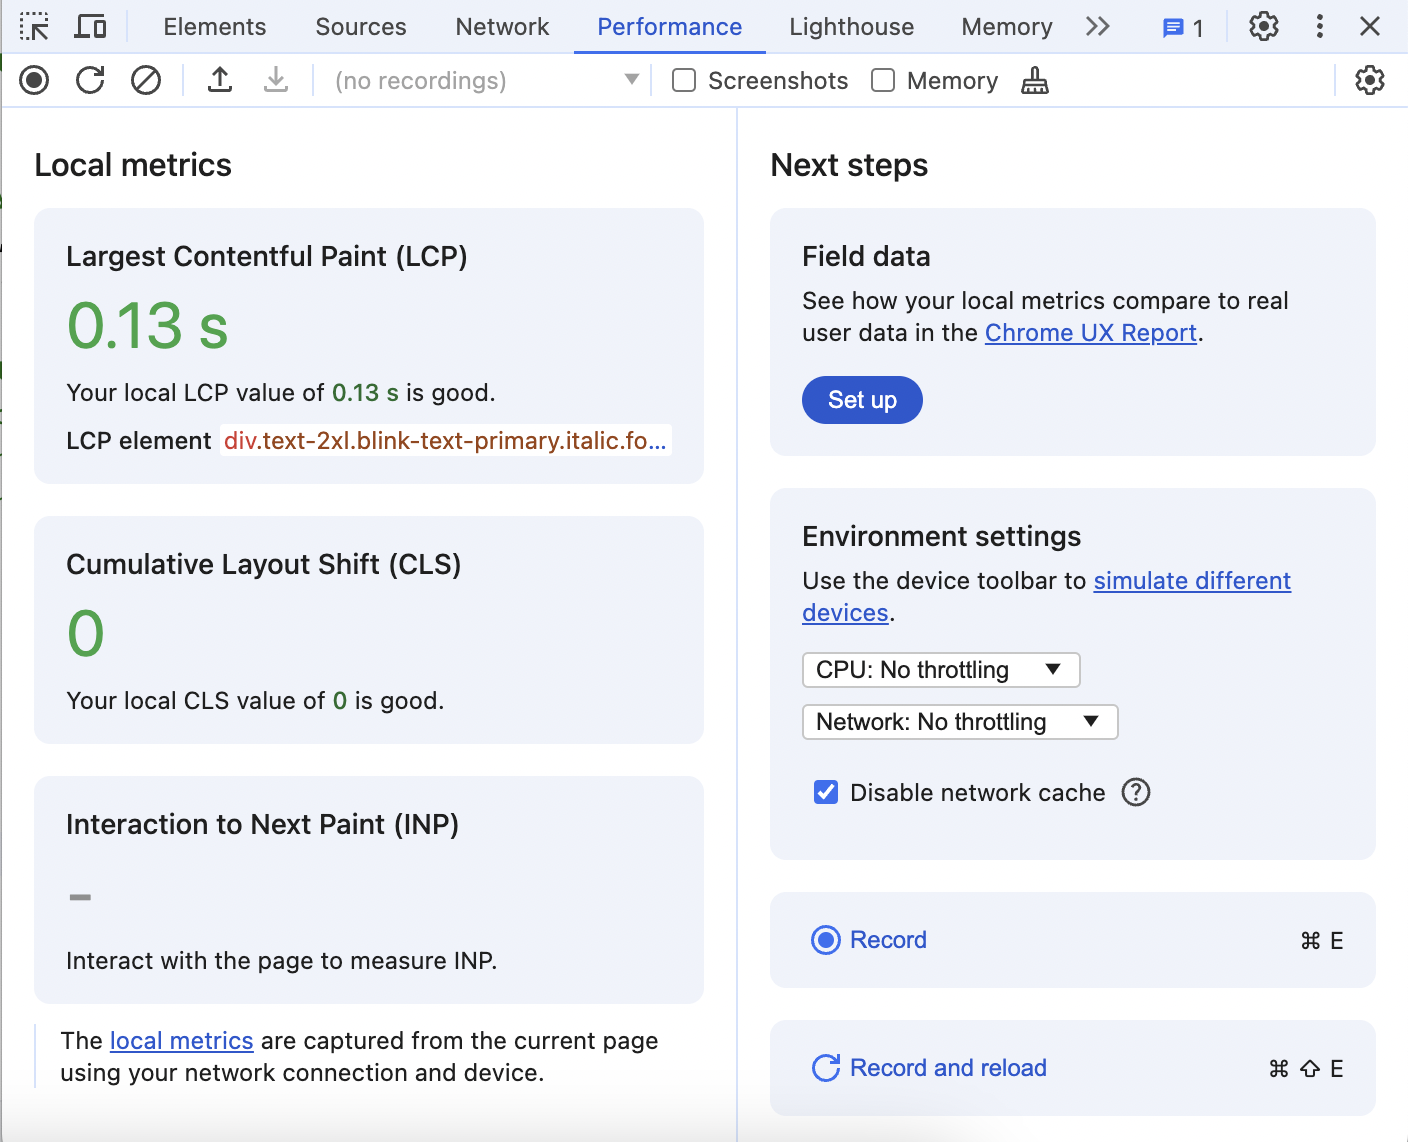
It shows the three Core Web Vitals metrics, one of which is our LCP, gives you the ability to simulate slow Network and CPU, and the ability to record performance details over time.
Find and check the "Screenshots" checkbox at the very top of the panel, then click the "Record and reload" button, and when the website reloads itself - stop the recording. This will be your detailed report on what is happening on the page during the initial load.
This report will have a few sections.
At the very top sits the general "timeline overview" section.
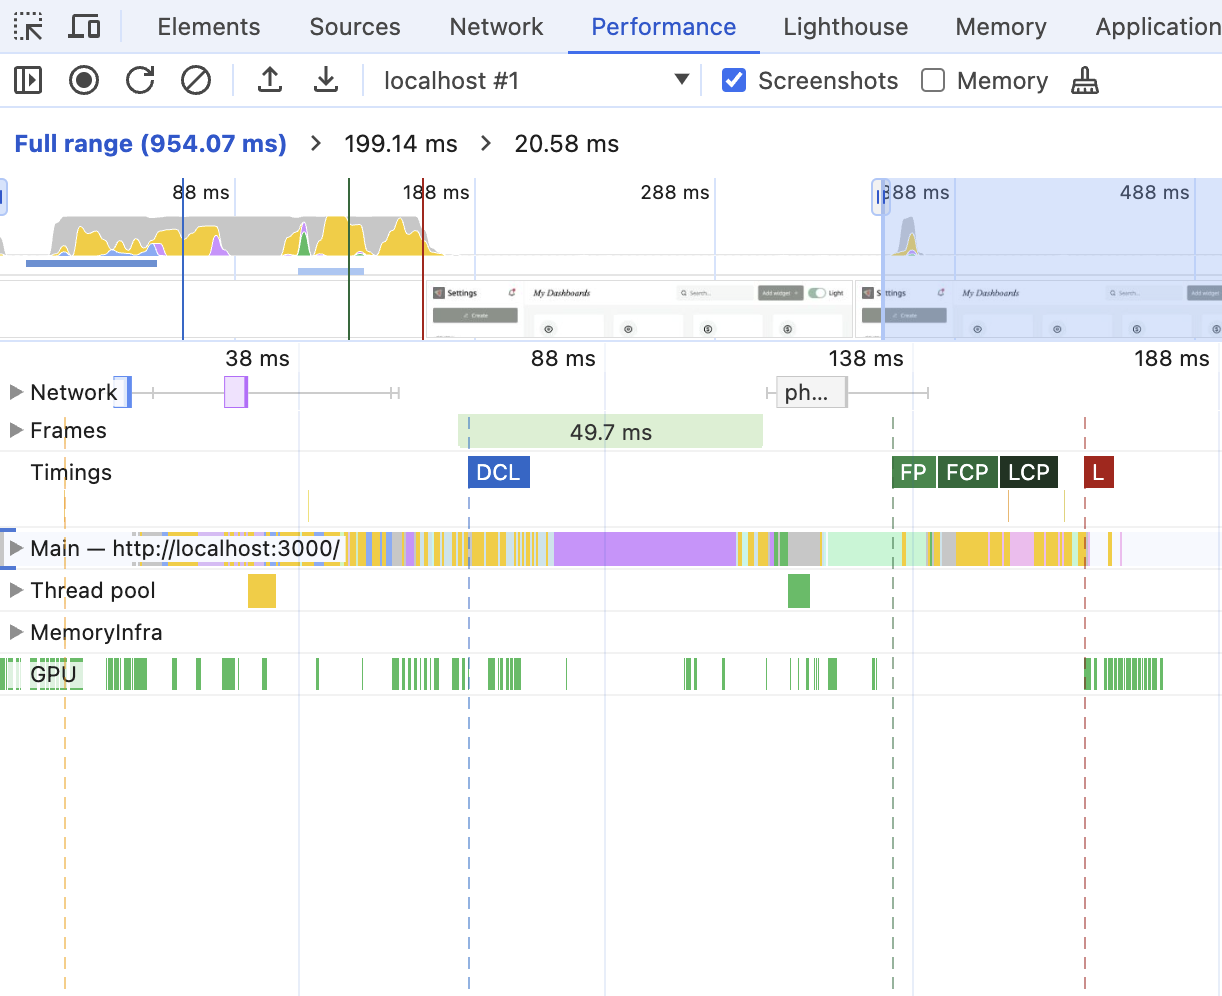
You'll be able to see here that something is happening on the website, but not much more. When you hover over it - the screenshot of what was happening will appear, and you'll be able to select and zoom in to a particular range to get a closer look.
Underneath, there is a Network section. When expanded, you'll see all the external resources that are being downloaded and at which exact time on the timeline. When hovering over a particular resource, you'll see detailed information on how much time was spent on which stage of the download. The resources with red corners will indicate the blocking resources.
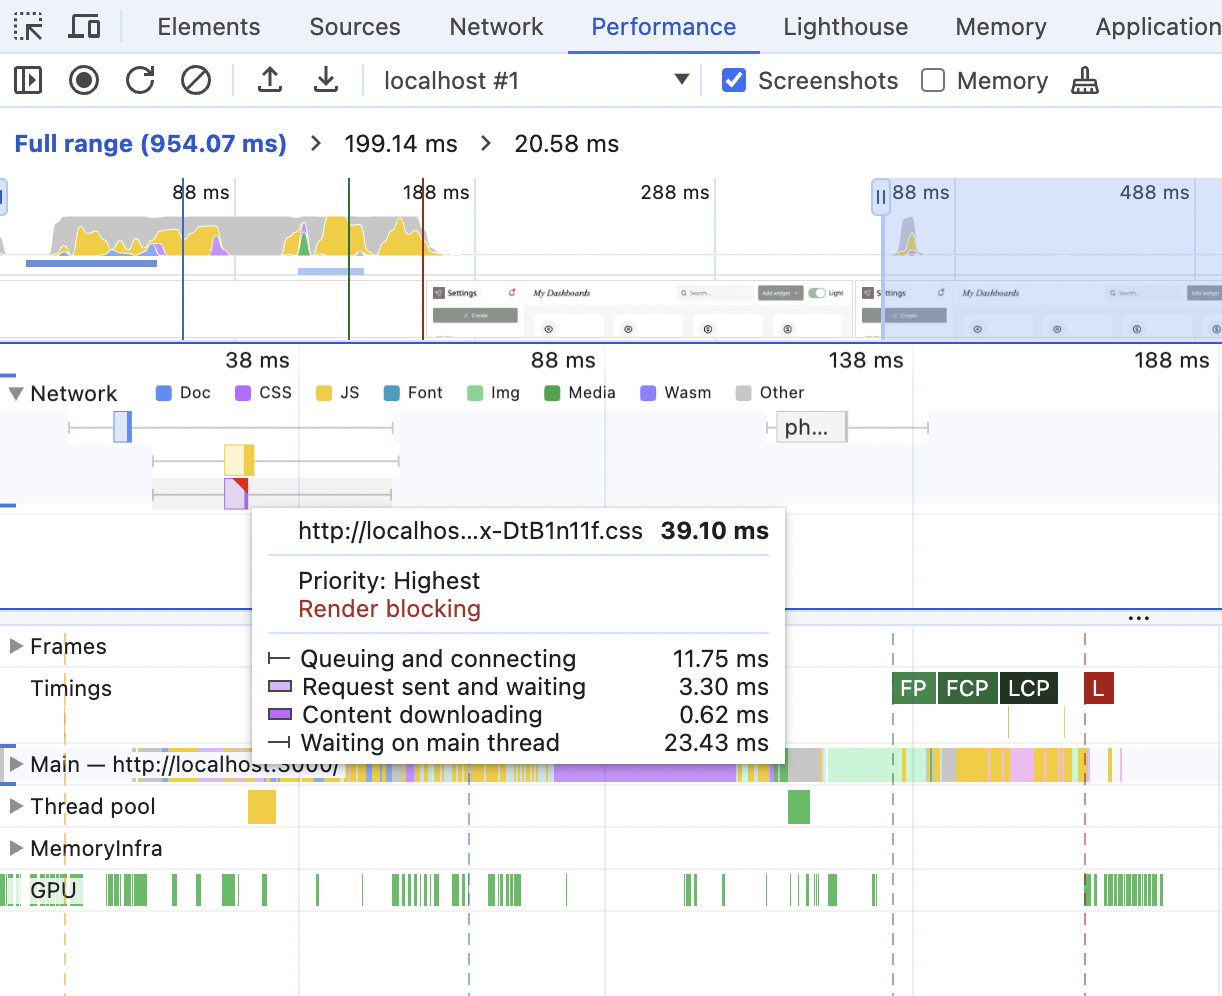
If you're working on the study project, you'll see exactly the same picture, and this picture matches what we went through in the previous section to the letter:
- At the beginning, there is the blue block - a request to get the HTML for the website
- After it's finished loading, after a bit of a pause (to parse the HTML), two requests for more resources go out.
- One of them (the yellow one) is for JavaScript - not blocking.
- Another one (the purple one) is for CSS, and this one is blocking.
If you open your study project code now and peek into the dist folder, the source code matches this behavior:
- There will be an
index.htmlfile and.cssand.jsfiles inside theassetsfolder - Inside the
index.htmlfile in the<head>section, there will be a<link>tag that points to the CSS file. As we know, CSS resources in the<head>are render-blocking, so that checks out. - Also, inside
<head>there is a<script>tag that points to the JavaScript file inside theassetfolder. It's neither deferred nor async, but it hastype="module". Those are deferred automatically, so this also checks out - the JavaScript file in the panel is non-blocking.
If you have a project you're working on, record the initial load performance for it and look into the Network panel. You'll likely see many more resources downloaded.
- How many render-blocking resources do you have? Are all of them necessary?
- Do you know where the "entry" point for your project is and how blocking resources appear in the
<head />section? Try building the project with your variation ofnpm buildand search for them. Hint: - If you have a pure webpack-based project, look for
webpack.config.jsfile. Paths to the HTML entry points should be inside. - if you're on Vite, look into
distfolder - same as with the study project - if you're on the Next.js App router - take a peek into
.next/server/appfolder
Under the Network section, you can find the Frames and Timing sections.
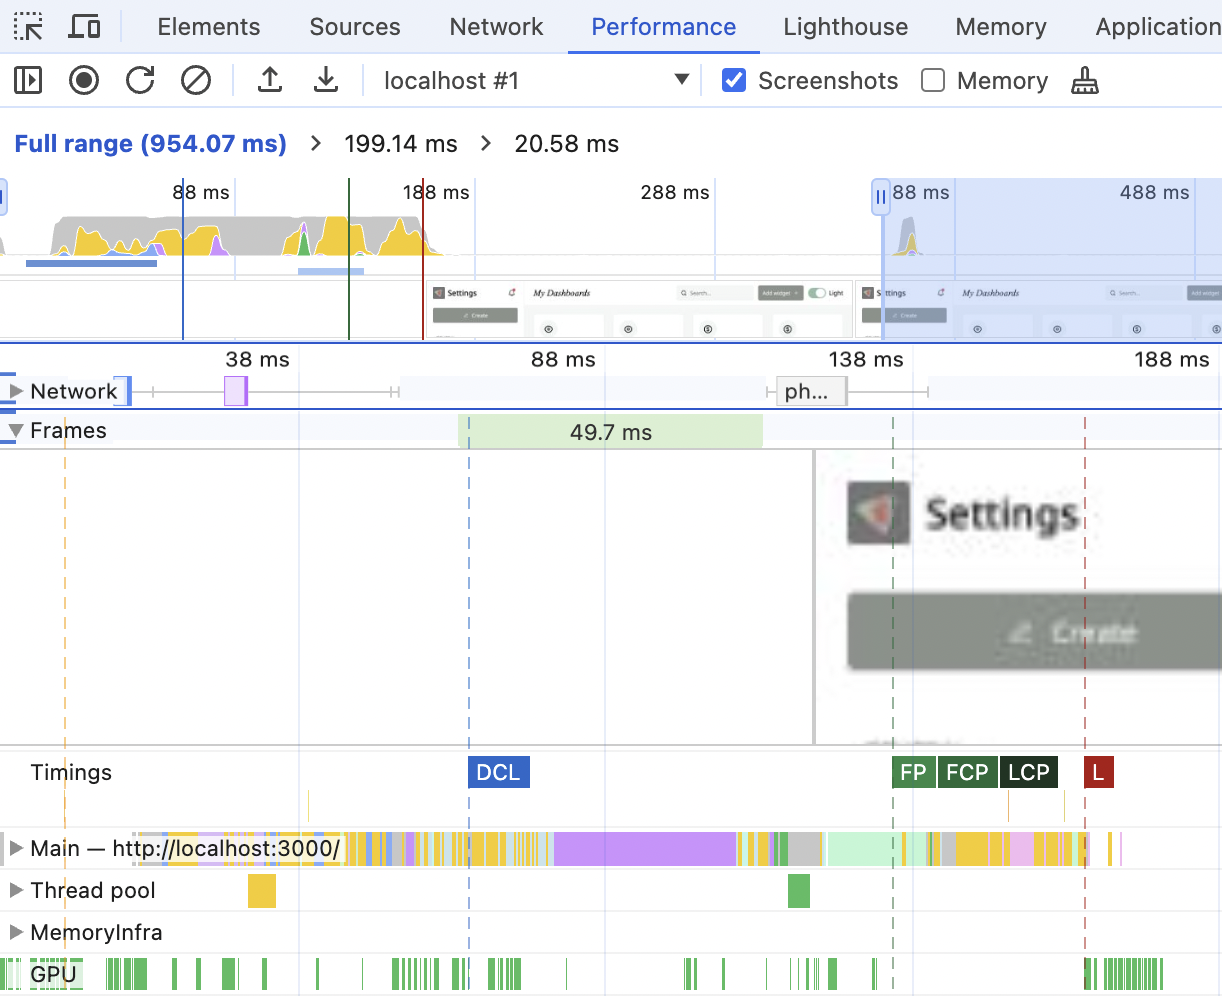
Those are very cool. In the Timing section, you can see all the metrics we discussed before (FP, FCP, LCP), plus a few more we haven't yet. When hovering over the metrics, you can see the exact time it took. Clicking on them will update the "summary" tab at the very bottom, where you'll find information on what this metric is and a link to learn more. DevTools are all about educating people these days.
And finally, the Main section. This is what is happening in the main thread during the timeline recorded.
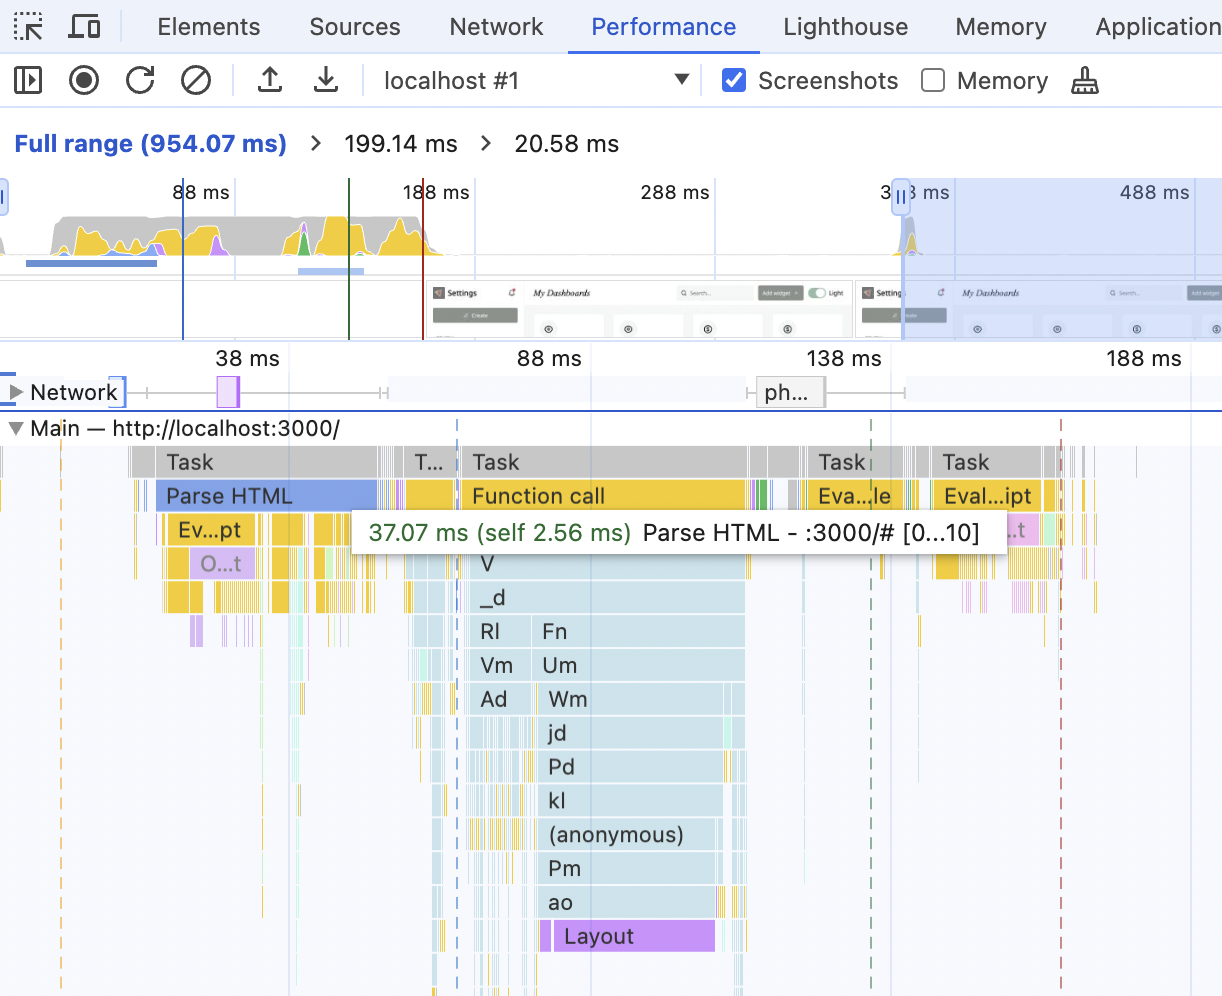
We can see stuff here like "Parse HTML" or "Layout" and how long it took. The yellow stuff is JavaScript-related, and they are a bit useless since we're using a production build with compressed JavaScript. But even in this state, it gives us a rough idea of how long the JavaScript execution takes compared to HTML parsing and drawing the Layout, for example.
It's especially useful for performance analysis when both Network and Main are open and zoomed in so they take the full screen.

From here, I can see that I have an incredibly fast server and fast and small bundles. None of the network tasks are a bottleneck; they don't take any significant time, and between them, the browser is just chilling and doing its own thing. So, if I wanted to speed up the initial load here, I need to look into why Parse HTML is so slow - it's the longest task on the graph.
Or, if we look at the absolute numbers - I shouldn't do anything here, performance-wise. The entire initial load takes less than 200ms and is way below Google's recommended threshold 🙂 But this is happening because I'm running this test locally (so no actual network costs), on a very fast laptop, and with a very basic server.
Time to simulate real life.
Exploring different network conditions
Very slow server
First of all, let's make the server more realistic. Right now, the very first "blue" step takes about 50ms, 40ms of which is just waiting.
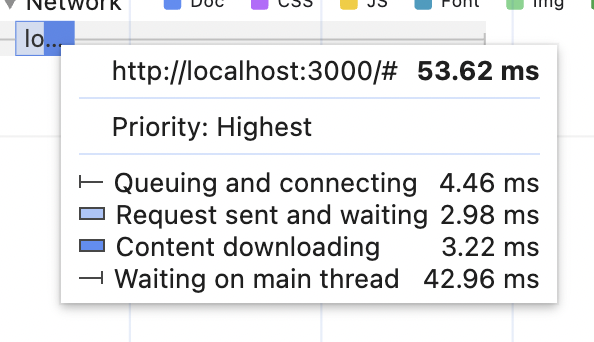
In real life, the server will do stuff, check permissions, generate stuff, check permissions two times more (because it has lots of legacy code and that triple-checking got lost), and otherwise will be busy.
Navigate to the backend/index.ts file in your study project (https://github.com/developerway/initial-load-performance ). Find the commented out // await sleep(500), and uncomment it. This will give the server a 500ms delay before it returns the HTML - it seems reasonable enough for an old and complicated server.
Re-build the project (npm run build), re-start it (npm run start) and re-run the performance recording.
Nothing has changed on the timeline except for the initial blue line - it's now incredibly long compared to the rest of the stuff.
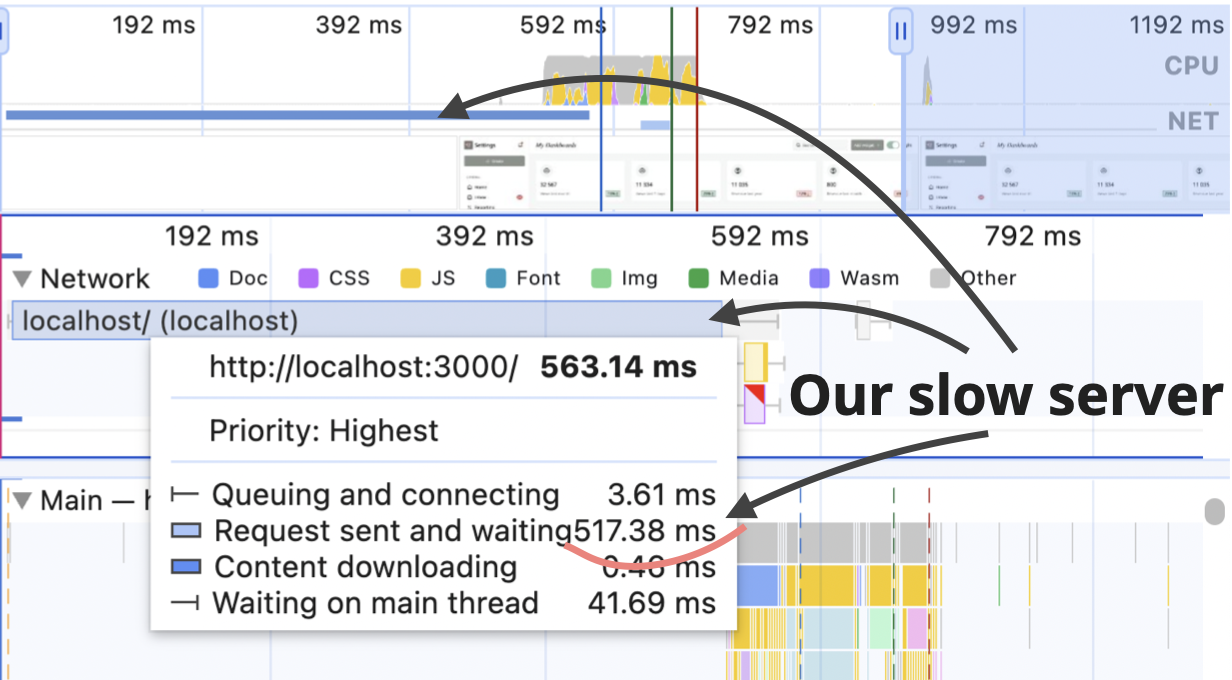
This situation highlights the importance of looking at the whole picture and identifying bottlenecks before doing any performance optimizations. The LCP value is ~650ms, out of which ~ 560ms is spent waiting for the initial HTML. The React portion of it is around 50ms. Even if I somehow manage to halve it and reduce it to 25ms, in the overall picture, it will be just 4%. And reducing it by half will require a lot of effort here. A much more effective strategy might be to focus on the server and figure out why it's so slow.
Emulating different bandwidth and latency
Not everyone lives in the world of a 1-gigabit connection. In Australia, for example, 50 megabits/second is one of the high-speed internet connections, and it will cost you around 90 Australian dollars a month. It's not 3G, of course, which plenty of people around the world are stuck with. But still, I cry every time I hear people in Europe bragging about their 1 gigabit/second or internet plans for 10 euros.
Anyway. Let's emulate this not-so-great Australian internet and see what will happen with the performance metrics. For that, clear the existing recording in the performance tab (the button near the reload and record). The panel with network settings should show up:
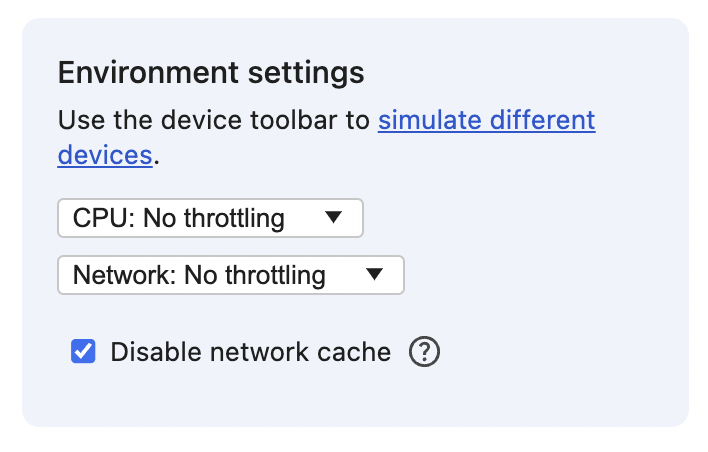
If it's not there in your version of Chrome, the same setting should be available in the Network tab.
Add a new profile in the "Network" dropdown with the following numbers:
- Profile Name: "Average Internet Bandwidth"
- Download: 50000 (50 Mbps)
- Upload: 15000 (15 Mbps)
- Latency: 40 (about average for general internet connection)
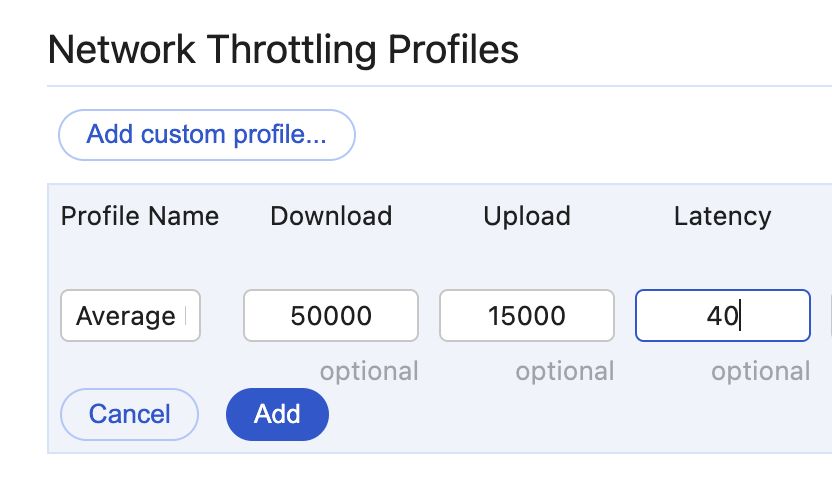
Now select that profile in the dropdown and re-run the performance recording again.
What do you see? For me, it looks like this.
LCP value barely changed - a slight increase from 640ms to 700ms. Nothing changed in the initial blue "server" part, which is explainable: it sends only the bare minimum HTML, so it shouldn't take long to download it.
But the relationship between the downloadable resources and the main thread changed drastically.
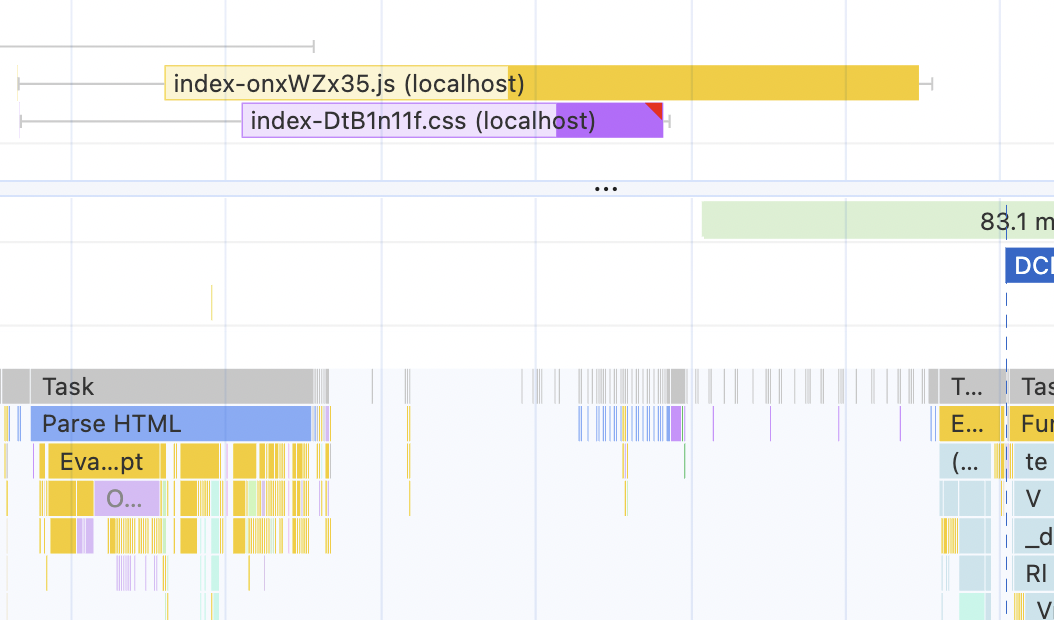
I can clearly see the impact of the render-blocking CSS file now. The Parse HTML task has finished already, but the browser is chilling and waiting for CSS - nothing can be painted until it's downloaded. Compare it with the previous picture, where the resources were downloaded almost instantly while the browser was parsing HTML.
After that, technically, the browser could've painted something - but there isn't anything, we're sending only an empty div in the HTML file. So the browser continues with the waiting until the javascript file is downloaded and can be executed.
This approximately 60ms gap of waiting is exactly the increase in the LCP that I'm seeing.
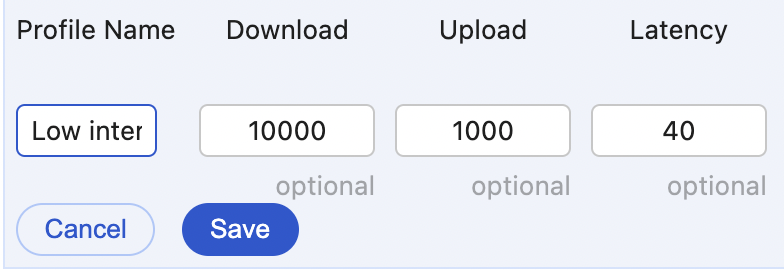
Downgrade the speed even more just to see how it progresses. Create a new Network Profile with 10mbps/1mbps for Download and Upload, keep the 40 latency, and name it "Low Internet bandwidth".
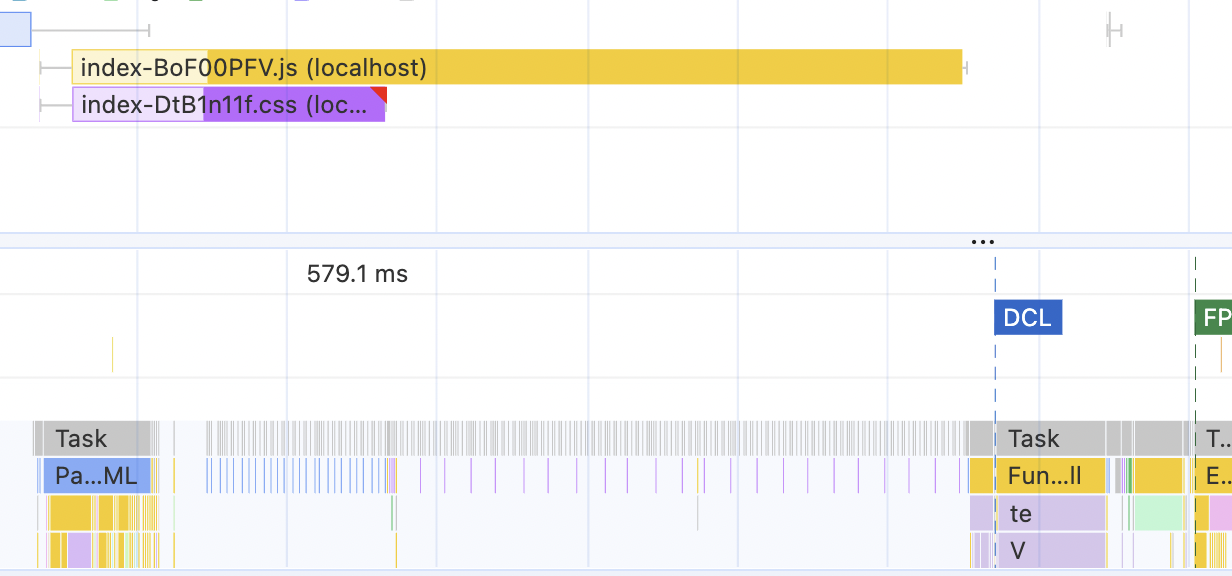
And run the test again.
The LCP value has increased to almost 500 ms now. The JavaScript download takes almost 300 ms. And the Parse HTML task and JavaScript executing tasks are shrinking in importance, relatively speaking.
If you have your own project, try to run this test on it.
- How long does it take to download all the critical path resources?
- How long does it take to download all the JavaScript files?
- How much of a gap does this download cause after the Parse HTML task?
- How large are the Parse HTML and JavaScript execution tasks in the main thread relative to the resource downloading?
- How does it affect the LCP metric?
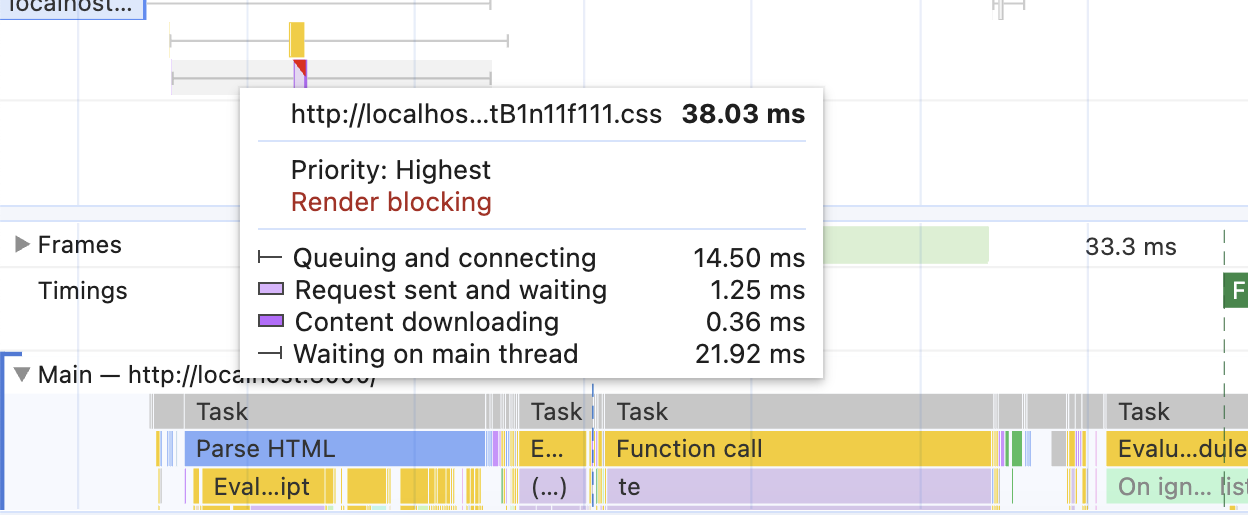
What's happening inside the resources bar is also quite interesting. Hover over the yellow JavaScript bar. You should see something like this there:
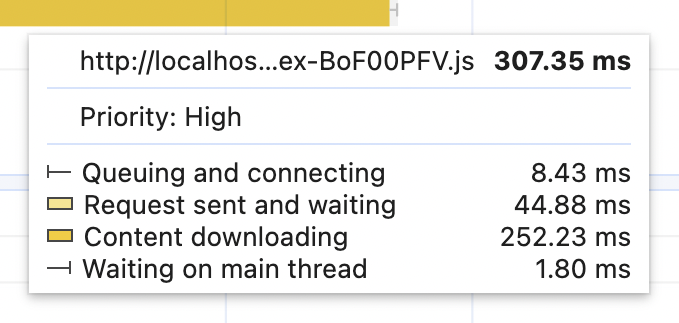
The most interesting part here is the "Request sent and waiting," which takes roughly 40 ms. Hover over the rest of the Network resources - all of them will have it. That's our Latency, the network delay, that we set to 40. Many things can influence the latency numbers. The type of the network connection is one of them. For example, an average 3G connection will have a bandwidth of 10/1 Mbps and latency between 100 and 300 ms.
To emulate that, create a new Network Profile, call it "Average 3G", copy the download/upload numbers from the "Low Internet bandwidth" profile, and set the latency to 300 ms.
Run the profiling again. All the Network resources should have "Request sent and waiting" increased to around 300 ms. This will push the LCP number even further: 1.2 seconds for me.
And now the fun part: what will happen if I revert the bandwidth to the ultra-high speeds but keep the low latency? Let's try this setting:
- Download: 1000 Mbps
- Upload: 100 Mbps
- Latency: 300 ms
This can easily happen if your servers are somewhere in Norway, but the clients are rich Australians.
This is the result:
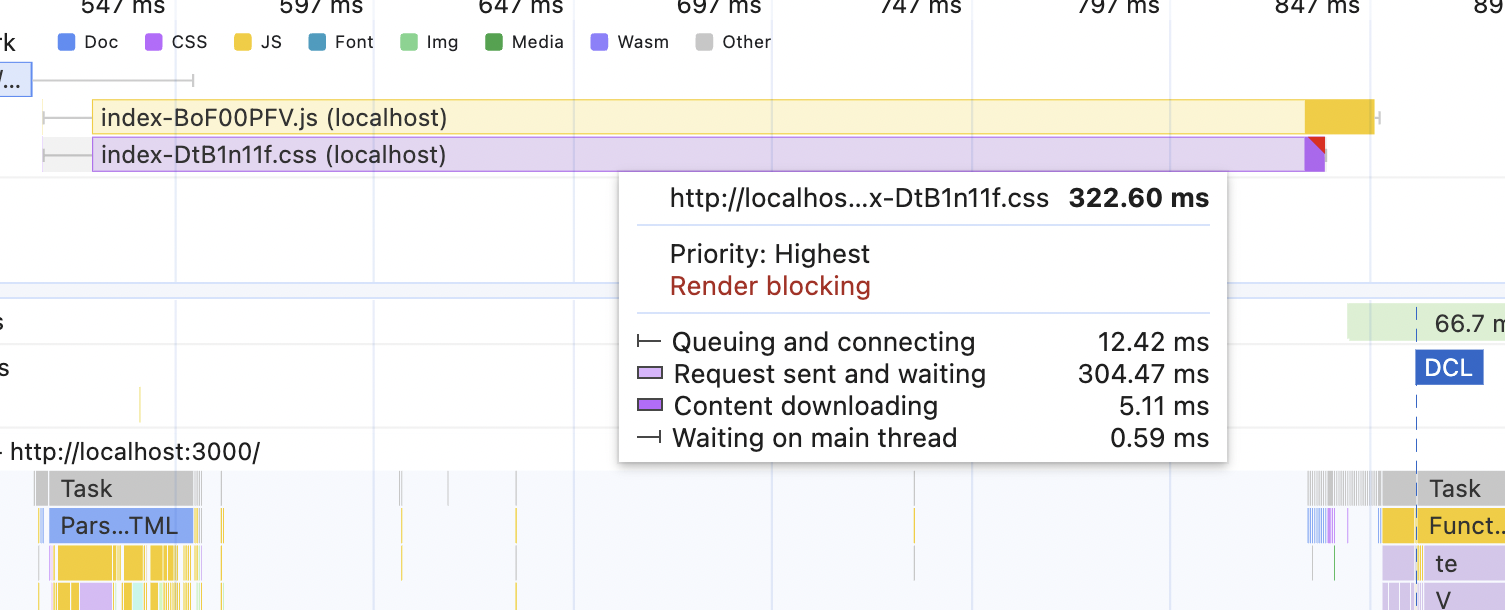
The LCP number is around 960ms. It's worse than the slowest internet speed we tried before! In this scenario, bundle size doesn't matter much, and the CSS size doesn't matter at all. Even if you halve both of them, the LCP metric will barely move. High latency trumps everything.
This brings me to the very first performance improvement everyone should implement if they haven't yet. It's called "make sure that the static resources are always served via a CDN."
The importance of CDN
CDN is basically a step 0 in anything frontend performance related, before even beginning to think about more fancy stuff like code splitting or Server Components.
The primary purpose of any CDN (Content Delivery Network) is to reduce latency and deliver content to the end user as quickly as possible. They implement multiple strategies for this. The two most important ones for this article are "distributed servers" and "caching."
A CDN provider will have several servers in different geographical locations. Those servers can store a copy of your static resources and send them to the user when the browser requests them. The CDN is basically a soft layer around your origin server that protects it from outside influence and minimizes its interaction with the outside world. It is kind of like an AI assistant for an introvert, which can handle typical conversations without the need to involve the real person.
In the example above, where we had servers in Norway and clients in Australia, we had this picture:

With the CDN in between, the picture will change. The CDN will have a server somewhere closer to the user, let's say also somewhere in Australia. At some point, the CDN will receive copies of the static resources from the origin server. After it does that, any user from Australia or anywhere close to it will get those copies rather than the originals from the server in Norway.
It achieves two important things. First, the load on the origin server is reduced since users don't have to access it directly anymore. And second, the users will get those resources much quicker now since they don't have to reach across oceans to download a few JavaScript files anymore.

And the LCP value in our simulation above drops from 960ms back to 640ms 🎉.
Repeat Visit Performance
Up until now, we have only been talking about first-time visit performance - performance for people who've never been to your website. But hopefully, the website is so good that most of those first-time visitors turn into regulars. Or at least they don't leave after the first load, navigate through a few pages, and maybe buy something. In this case, we usually expect the browsers to cache the static resources like CSS and JS - i.e., save a copy of them locally rather than always downloading them.
Let's take a look at how the performance graphs and numbers change in this scenario.
Open the study project again. In the dev tools, set the Network to the "Average 3G" we created earlier - with high latency and low bandwidth, just so we can see the difference right away. And make sure that the "disable network cache" checkbox is unchecked.
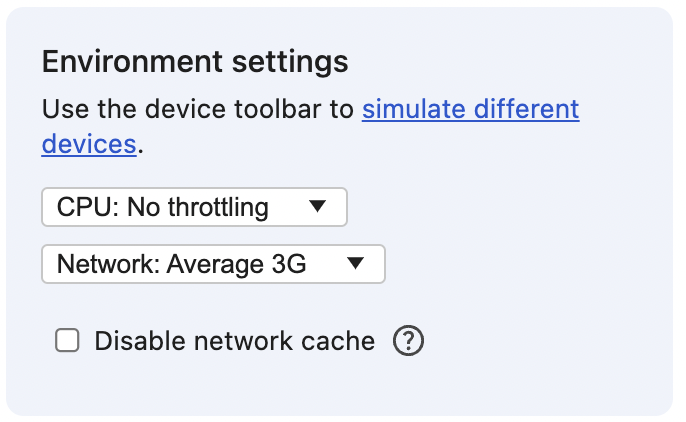
First, refresh the browser to make sure that we're eliminating the first-time visitor situation. And then refresh and measure the performance.
If you're using the study project, the end result should be slightly surprising because it will look like this:
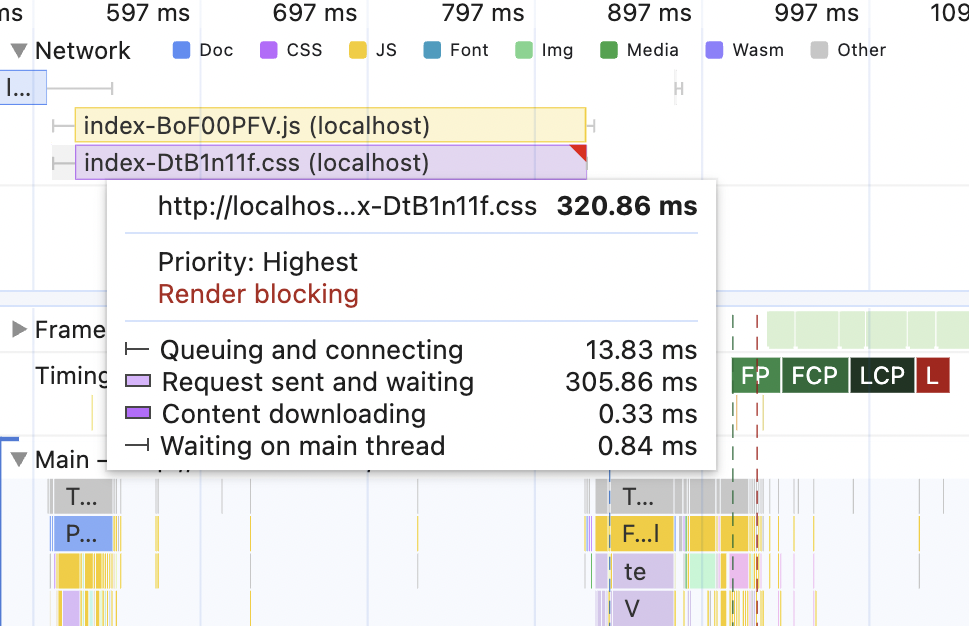
The CSS and JavaScript files are still very prominent in the network tab, and I see ~300ms for both of them in "Request sent and waiting" - the latency setting we have in the "Average 3G" profile. As a result, the LCP is not as low as it could be, and I have a 300ms gap when the browser just waits for the blocking CSS.
What happened? Wasn't the browser supposed to cache those things?
Controlling Browser Cache with Cache-Control Headers
We need to use the Network panel now to understand what's going on. Open it and find the CSS file there. It should look something like this:

The most interesting things here are the "Status" column and "Size". In "Size" it's definitely not the size of the entire CSS file. It's too small. And in "Status," it's not our normal 200 "all's okay" status, but something different - 304 status.
Two questions here - why 304 instead of 200, and why was the request sent at all? Why didn't caching work?
First of all, the 304 response. It's a response that a well-configured server sends for conditional requests - where the response varies based on various rules. Requests like this quite often are used to control browser cache.
For example, when the server receives a request for a CSS file, it could check when the file was last modified. If this date is the same as in the cashed file on the browser side, it returns the 304 with an empty body (that's why it's just 223 B). This indicates to the browser that it's safe to just re-use the file it already has. There is no need to waste the bandwidth and re-download it again.
That's why we see the large "request sent and waiting" number in the performance picture - the browser asks the server to confirm whether the CSS file is still up-to-date. And that's why the "content downloading" there is 0.33ms - the server responded with "304 Not Modified" and the browser just re-used the file it downloaded before.
- In the study project, go to the
dist/assetsfolder and rename the CSS file. - Go to the
dist/index.htmlfile and update the path to the renamed CSS file. - Refresh the already opened page with the opened Network tab You should see the CSS file appear with the new name, 200 status, and the proper size - it was downloaded again. It's known as "cache-busting" - a way to force the browser to re-download the resources it might have cached.
- Refresh the page again - it's back to the 304 status and re-using the cached file.
Now, to the second question - why was this request sent at all?
This behavior is controlled by the Cache-Control header the server sets to the response. Click on the CSS file in the Network panel to see the details of the request/response. Find the "Cache-Control" value in the "Headers" tab in the "Response Headers" block:
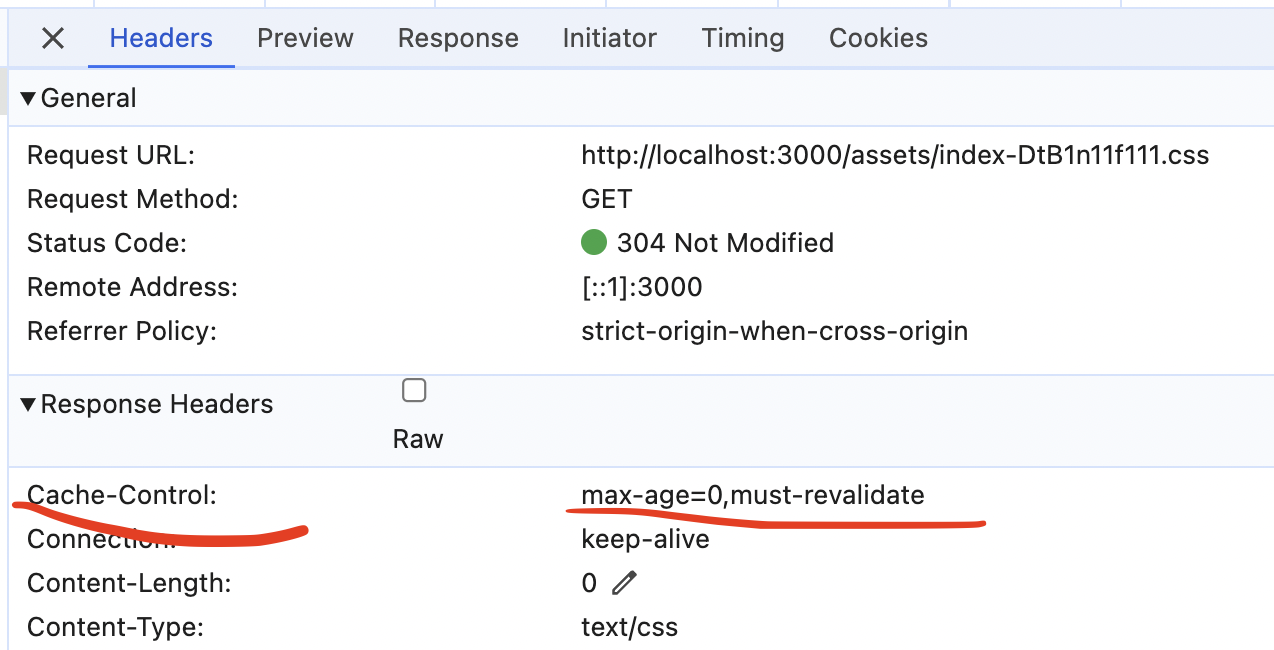
Inside this header can be multiple directives in different combinations, separated by a comma. In our case, there are two:
- max-age with a number - it controls for how long (in seconds) this particular response is going to be stored
- must-revalidate - it directs the browser to always send a request to the server for a fresh version if the response is stale. The response will turn stale if it lives in the cache for longer than the max-age value.
So basically, what this header tells the browser is:
- It's okay to store this response in your cache, but double-check with me after some time to make sure.
- By the way, the time that you can keep that cache is exactly zero seconds. Good luck.
As a result, the browser always checks with the server and never uses the cache right away.
We can easily change that, though - all we need is to change that max-age number to something between 0 and 31536000 (one year, the maximum seconds allowed). To do that, in your study project, go to the backend/index.ts file, find where max-age=0 is set, and change it to 31536000 (one year). Refresh the page a few times, and you should see this for the CSS file in the Network tab:

Notice how the Status column is grayed out now, and for Size, we see "(memory cache)". The CSS file is now served from the browser's cache and it will be so for the rest of the year. Refresh the page a few times to see that it doesn't change.
Now, to the whole point of messing with the cache headers: let's measure the performance of the page again. Don't forget to set the "Average 3G" profile setting and keep the "disable cache" setting unchecked.
The result should be something like this:
The "Request sent and waiting" part collapsed to almost zero despite the high latency, the gap between "Parse HTML" and JavaScript evaluation almost disappeared, and we're back to the ~650ms for LCP value.
- Change the
max-agevalue to 10 now (10 seconds). - Refresh the page with the "disable cache" checkbox checked to drop the cache.
- Uncheck the checkbox and refresh the page again - it should be served from the memory cache this time.
- Wait for 10 seconds, and refresh the page again. Because the
max-ageis only 10 seconds, the browser will double-check the resource, and the server will return the 304 again. - Refresh the page immediately - it should be served from memory again.
Cache-Control And Modern Bundlers
Does the above information mean that the cache is our performance silver bullet and that we should cache everything aggressively as much as possible? Absolutely not! Aside from everything else, the chance to create a combination of "not tech-savvy customers " and "need to explain over the phone how to clear browser cache" will cause panic attacks for the most seasoned developers.
There are a million ways to optimize the cache, a million combinations of the directives in the Cache-Control header in combination with other headers that may or may not influence how long the cache lives, which also may or may not depend on the implementation of the server. Probably a few books worth of information can be written just on this topic alone. If you want to become the Master of Cache, start with articles onhttps://web.dev/ and MDN resources, and then follow the breadcrumbs.
Unfortunately, nobody can tell you, "this is the five best cache strategies for everything." At best, the answer can be: "if you have this use case, in combination with this, this, and this, then this cache settings combination is a good choice, but be mindful of those hiccups". It all comes down to knowing your resources, your build system, how frequently the resources change, how safe it is to cache them, and what the consequences are if you do it wrong.
There is, however, one exception to this. An exception in a way that there is a clear "best practice": JavaScript and CSS files for websites built with modern tooling. Modern bundlers like Vite, Rollup, Webpack, etc., can create "immutable" JS and CSS files. They are not truly "immutable", of course. But those tools generate names for files with a hash string that depends on the content of the file. If the file's content changes, then the hash changes, and the name of the file changes. As a result, when the website is deployed, the browser will re-fetch a completely fresh copy of the file regardless of the cache settings. The cache is "busted," exactly like in the exercise before when we manually renamed the CSS file.
Take a look at the dist/assets folder in the study project, for example. Both js and CSS files have index-[hash] file names. Remember those names and run npm run build a few times. The names stay exactly the same since the content of those files didn't change.
Now go to src/App.tsx file and add something like a console.log('bla') somewhere. Run npm run build again, and check the generated files. You should see that the CSS file name stays exactly as it was before, but the JS file name changes. When this website is deployed, the next time a repeated user visits it, the browser will request a completely different JS file that never appeared in its cache before. The cache is busted.
Find the equivalent of the
dist folder for your project and run your build command.- What do the names of the files look like? Similar with hashes, or plain
index.js,index.css, etc? - Do the names of the files change when you re-run the build command again?
- How many file names change if you make a simple change somewhere in the code?
If this is how your build system is configured - you're in luck. You can safely configure your servers to set the maximum max-age header for generated assets. If you similarly version all your images - even better, you can include images to the list as well.
Depending on the website and its users and their behavior, this might give you a pretty nice performance boost for the initial load for free.
Do I really need to know all of this for my simple use case?
By this time, you might be thinking something like, "You're insane. I built a simple website over the weekend with Next.js and deployed it to Vercel/Netlify/HottestNewProvider in 2 minutes. Surely, those modern tools handle all of this for me?". And fair enough. I also thought that. But then I actually checked, and boy, was I surprised 😅
Two of my projects had max-age=0 and must-revalidate for CSS and JS files. Turned out it's the default in my CDN provider 🤷🏻♀️. They, of course, have a reason for this default. And luckily, it's easy to override, so no big deal. But still. Can't trust anyone or anything these days 😅.
What about your hosting/CDN provider? How sure are you about their cache headers configuration?
Hope that was a fun investigation, you learned something new and maybe even fixed an issue or two in your projects. I'm off working on the rest of the metrics now, while you're playing around with the study project (I hope). See you soon!
Table of Contents
Want to learn even more?

Web Performance Fundamentals
A Frontend Developer’s Guide to Profile and Optimize React Web Apps

Advanced React
Deep dives, investigations, performance patterns and techniques.
Advanced React Mini-Course
Free YouTube mini-course following first seven chapters of the Advanced React book