Client-Side Rendering in Flame Graphs
Nadia Makarevich

Welcome to the new article in the series "Non-React Stuff for React Developers" 😅. In the previous article, we figured out how to start measuring performance and measured initial rendering and LCP for a few different scenarios. Armed with this information, we can now start talking about different render patterns and what's the point of them.
We're going to start with the oldest and still the most popular pattern in the React world: Client-side rendering. We'll look into what it does and the cost of doing it. But before that, we need to figure out what a performance Flame Graph is, how to read it in a simple scenario, and how to extract something useful from it for more real-life apps.
There will be a Study project again, so make sure to clone it and install it!
Client-Side Rendering
Let's start with a definition. What is Client-Side Rendering?
Actually, it's what we investigated in the previous article! There, we had a React project that, when built, turned out to be just an index.html file with an empty div, a JS file, and a CSS file inside. Something like this:
<html lang="en"><head><scripttype="module"crossoriginsrc="/assets/index-Cx2U5bbX.js"></script><linkrel="stylesheet"crossoriginhref="/assets/index-BjPt9w-2.css"/></head><body><div id="root"></div></body></html>
The entire beautiful Home page that we see when we start this project is generated entirely by the JavaScript file and React inside of it.
React takes everything that we wrote, converts it into DOM nodes, finds the element with the id root, and appends the newly created DOM elements to that element using your regular JavaScript commands. It looks something like this:
// React grabs our App and does whatever it needs to do with itconst domElements = ReactDoYourThing(App);// Get the "root" element with your regular JavaScriptconst rootDomElement = document.getElementById('root');// Append the elements to the rootrootDomElement.appendChild(domElements);
After the browser is done executing all this JavaScript, the user suddenly sees the entire page appearing out of the blue.
If you look inside the main.tsx file of the study project, you'll see almost exactly the same code there:
import { StrictMode } from 'react';import { createRoot } from 'react-dom/client';import './index.css';import App from './App';createRoot(document.getElementById('root')!).render(<StrictMode><App /></StrictMode>,);
This is the entry point to any React app. This process of generating the full DOM with JavaScript and then injecting it into an empty page is what we know as "Client-Side Rendering."
What does this mean from a performance perspective?
To truly understand that, we need the Performance panel again, this time the "main" section. Let's build and start our Study project:
npm run buildnpm run start
Open the Chrome DevTools, open the Performance panel, record the performance, expand the "main" section, and you should see a pretty obvious picture like this:
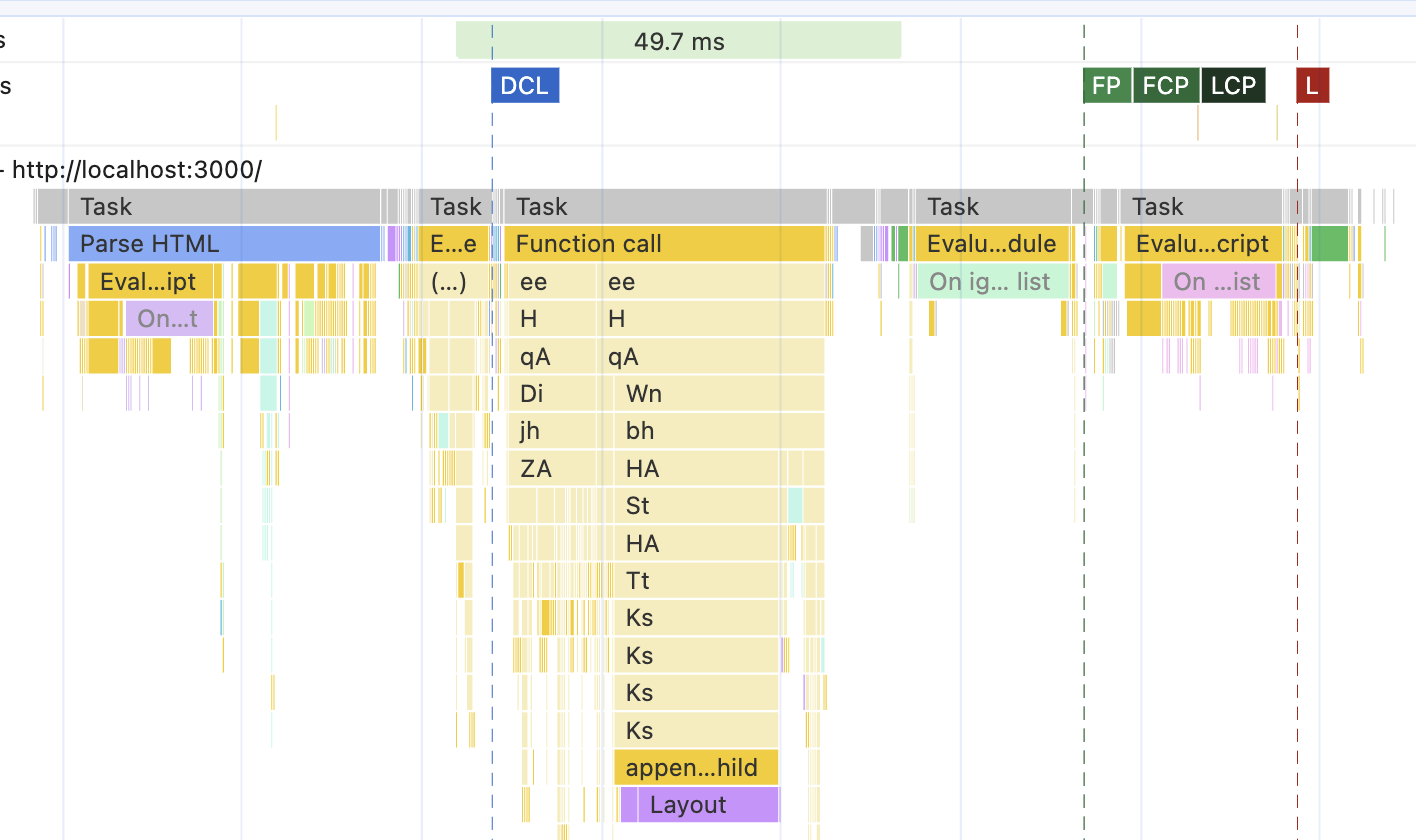
Okay, I'm joking, of course, about it being "pretty obvious." Unless you've been reading these graphs every day for years for fun and profit, this picture will probably tell you nothing. So before continuing with React again, let's figure out what it means and what can be found there.
Reading the Flame Graph
This picture is known as the "Flame Graph" or sometimes a Flame Chart. Graphs like this represent an application's call stack relative to the resources you want to investigate, like memory or, in our case, time in milliseconds.
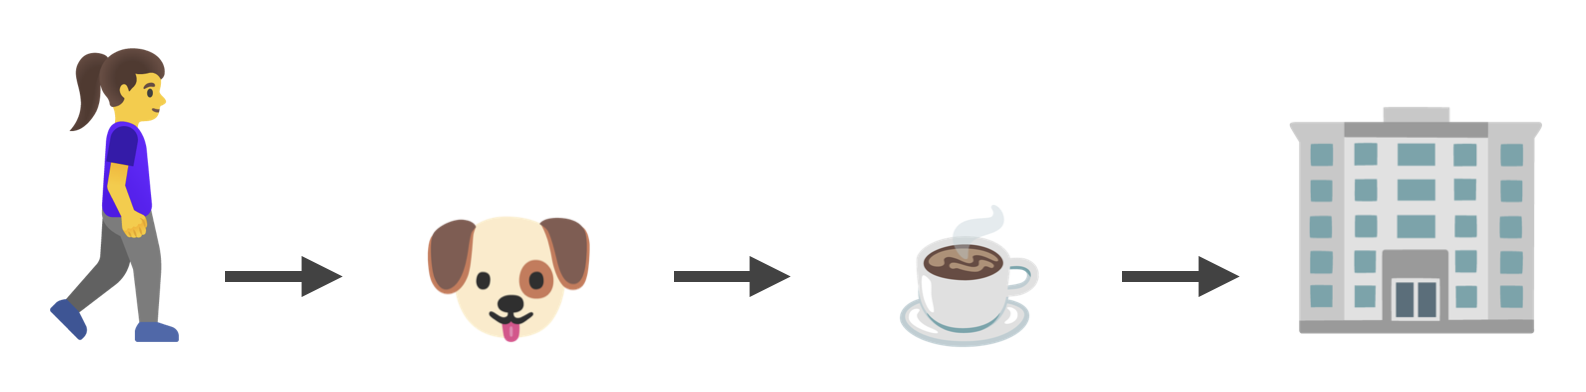
Imagine a function that describes the daily commute of a developer:
- A developer leaves home and starts walking while humming some tune and listening to a podcast.
- Then they stop to pet a cute dog.
- After some more walking, they stop to grab a coffee, which consists of:
- waiting in line for a minute or two to order the coffee
- waiting a few more minutes to actually get the coffee
- After that, they continue walking while drinking coffee.
The entire flow is the function goToWork. While executing, this function at some point triggers the petADog function and waits until it's finished. After that, the function getSomeCoffee is triggered. This function also triggers another function - orderCoffee. After its execution, the getSomeCoffee function waits for the coffee and returns it once it's done. After that, the core function goToWork continues until the developer arrives at their destination.
const goToWork = async () => {await petADog();const coffee = await getSomeCoffee();await finishWalking(coffee);};
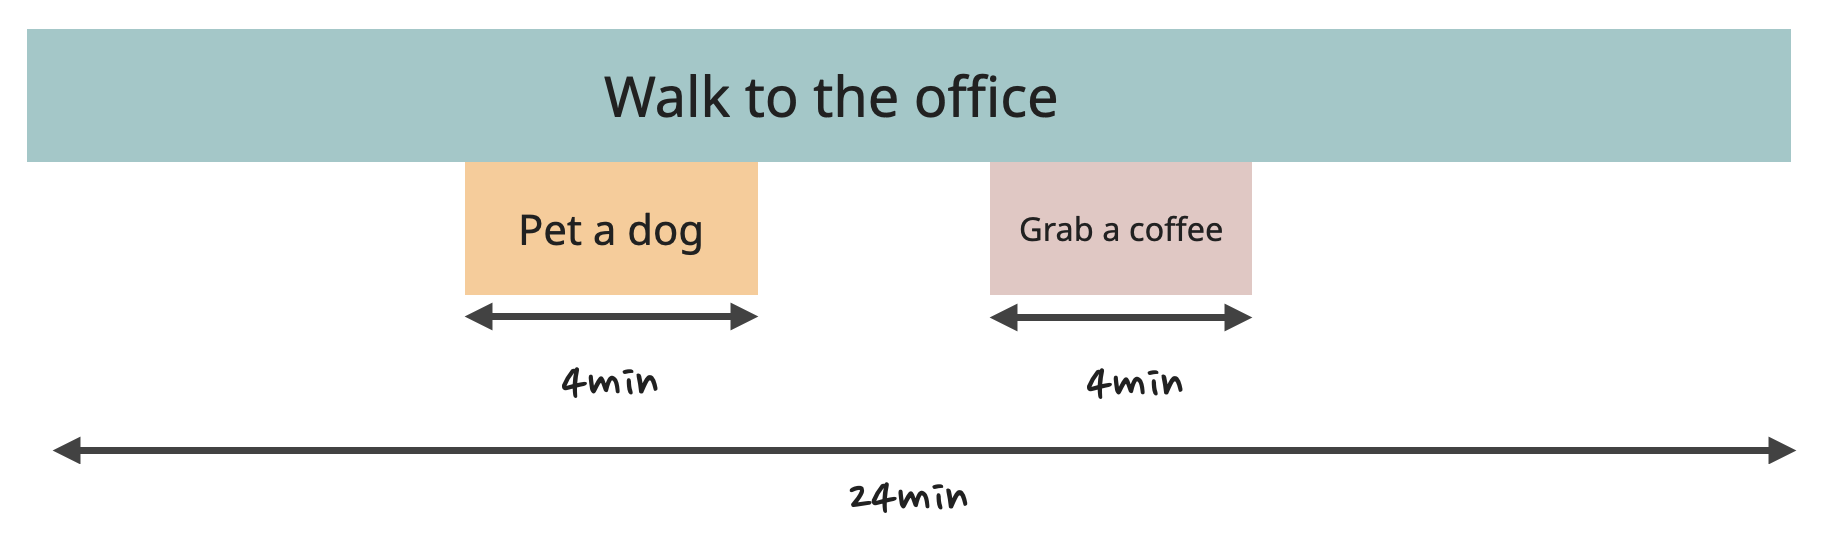
This describes what is known as the Call stack. In the flame graph, it will look like this:

The most important thing about this graph right now is that it clearly shows us which task originated from where.
- The "Pet a dog" task was triggered by "Walk to the office," and it's completely independent of the coffee situation.
- The "Order coffee" task originated from the "Grab a coffee" task, which in turn was also triggered by "Walk to the office."
- The "Order coffee" task has nothing to do with the "Pet a dog" task - it's not within its hierarchy. If the "Grab a coffee" task disappears one day, the "Order coffee" will disappear with it since it's its "child," but the "Pet a dog" task will never notice it.
Another important thing here is that the graph shows the duration of all the tasks.
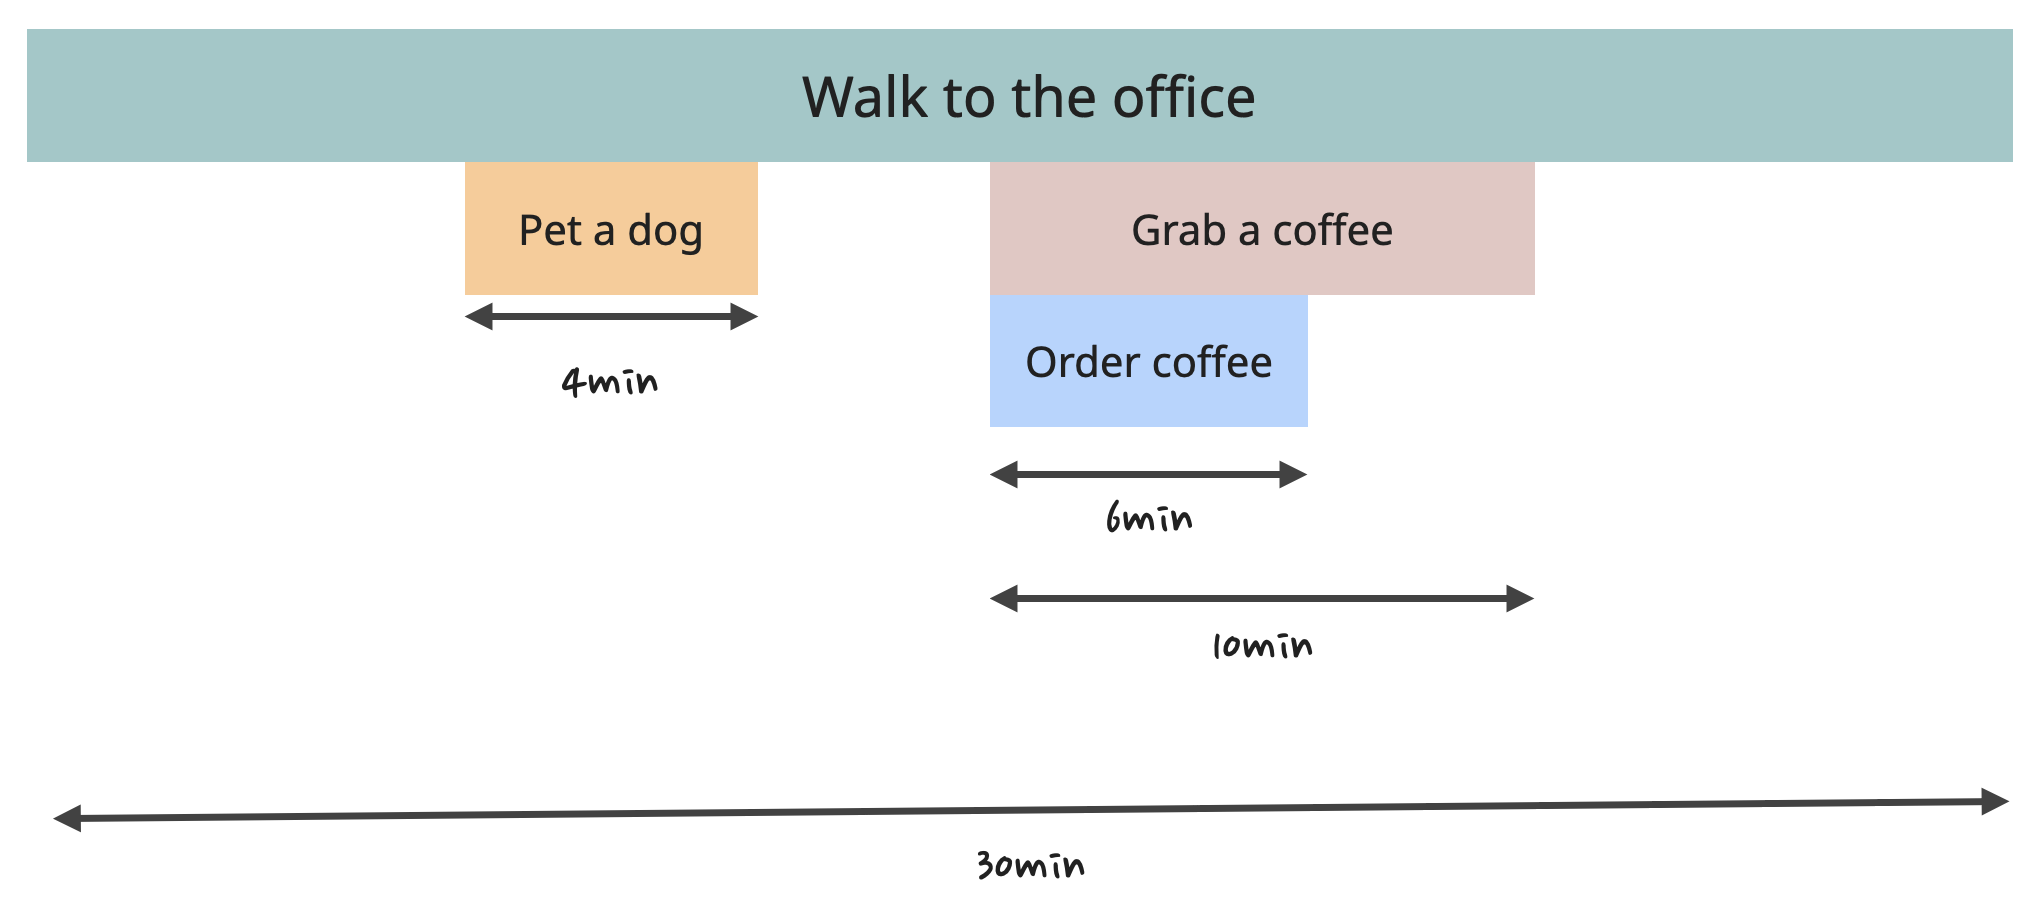
For example, the "Grab a coffee" task took 10 minutes, of which the developer spent 6 minutes waiting in line to place the order. This 10 minutes is known as "Total Time" - the time it takes to execute a function, including the execution time of all its children. The Total Time of the "Walk to the office" is 30 minutes, out of which it took 4 minutes to execute "Pet a dog" and 10 minutes for "Grab a coffee," of which 6 minutes were spent in line ordering the coffee.
The difference between the Total Time and the time it took for the children to execute is known as "Self Time." In this example (30 - 4 - 10), it's 16 minutes for the "Walk to the office" function. This 16 minutes is the time the developer spent actually walking. For "Grab a coffee," it's 4 minutes.
This knowledge of Self Time, Total Time, and the structure of the children is what enables us to do some performance optimizations. And most importantly, calculate trade-offs and the cost of optimizations.
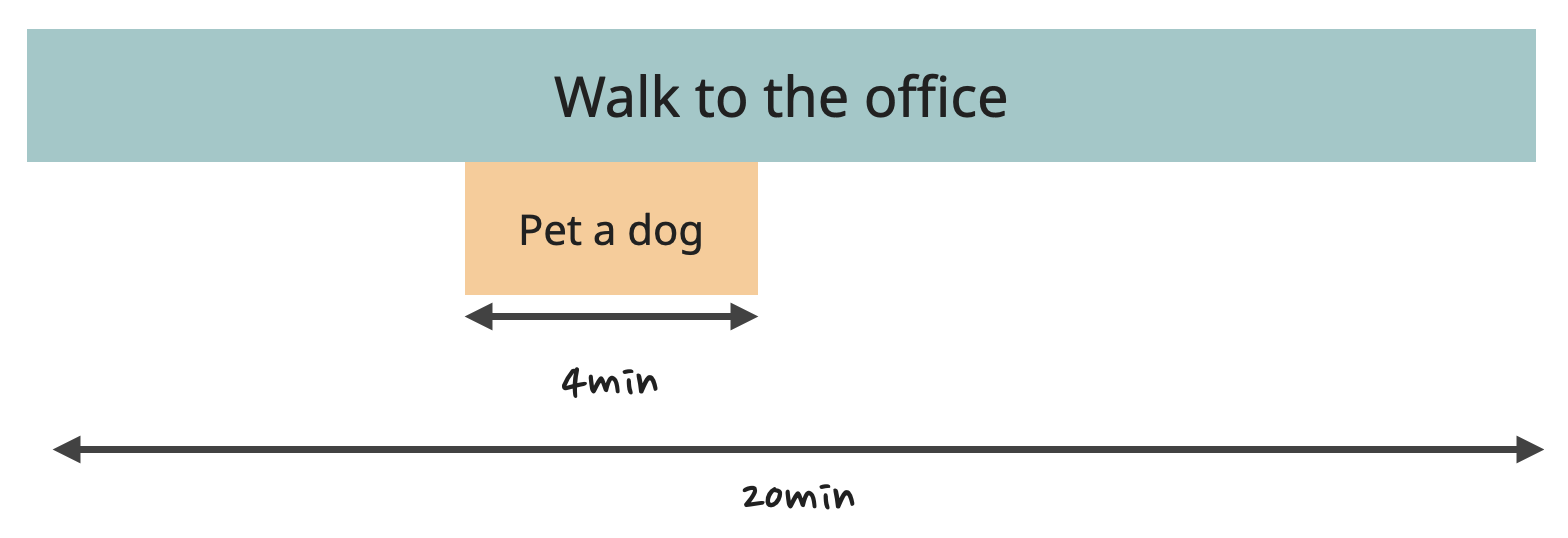
Let's say I want to reduce the "Walk to the office" time to 20 minutes. What are my options?
I could just get rid of the "coffee" task completely and accomplish the goal immediately.
The cost here would be to significantly impact the quality of life of a developer, plus productivity for the rest of the day. It might not be the best option unless you really need a quick win right now.
Instead, I could get rid of the "Order coffee" task by pre-ordering coffee through an app while walking. The cost here is pretty minimal, just need to download an app and create an account there.
The "Grab a coffee" task is still present - the developer still needs to walk to the counter, find the coffee there, and squeeze through the crowds to get out. So, the function's Self Time will remain.
Now I just need to find another 4 minutes. I could get rid of the "Pet a dog" task, but similar to the "coffee" task, the cost here would be the impacted mood of the developer and their productivity for the rest of the day.
Another option here would be to reduce the Self Time of the "Walk to the office" task itself. I could buy the developer a scooter or a bike, for example, to speed it up. Or arrange some sort of transport that picks up employees and delivers them to work. Or work with the government to organize more footpaths without street lights that slow down the walk. Or just encourage the developer to run instead of walk somehow.
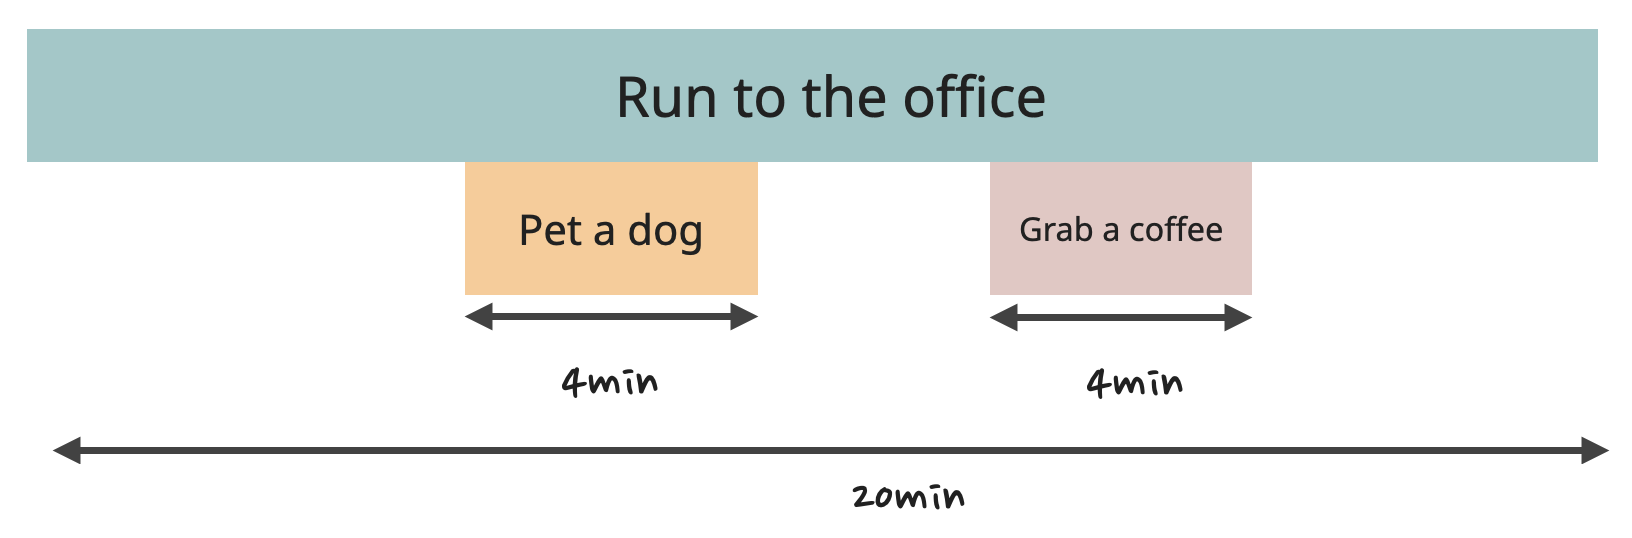
In any case, the performance goal is accomplished again, assisted by the Flame Graph.
Reading the Flame Graph in DevTools
Time to switch back to the real graph.
Start your Study project, navigate to "http://localhost:3000/go-to-work," and record the performance. The graph for this page looks exactly like the illustration above! Kinda.
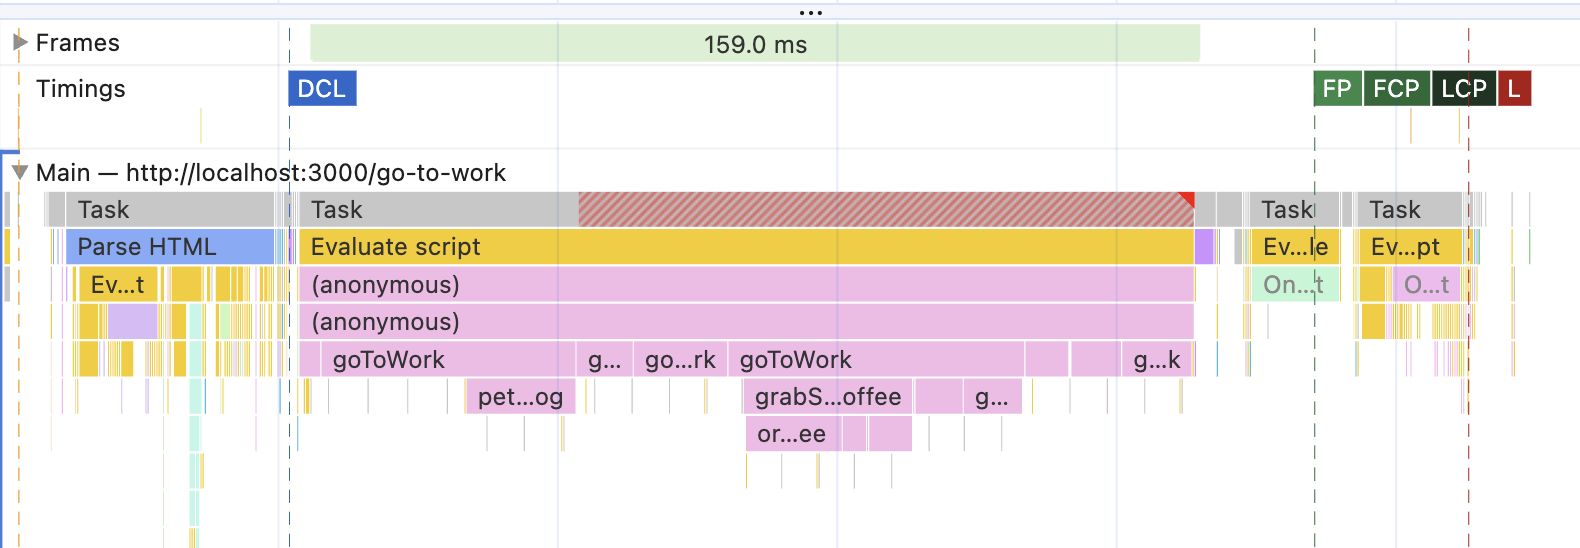
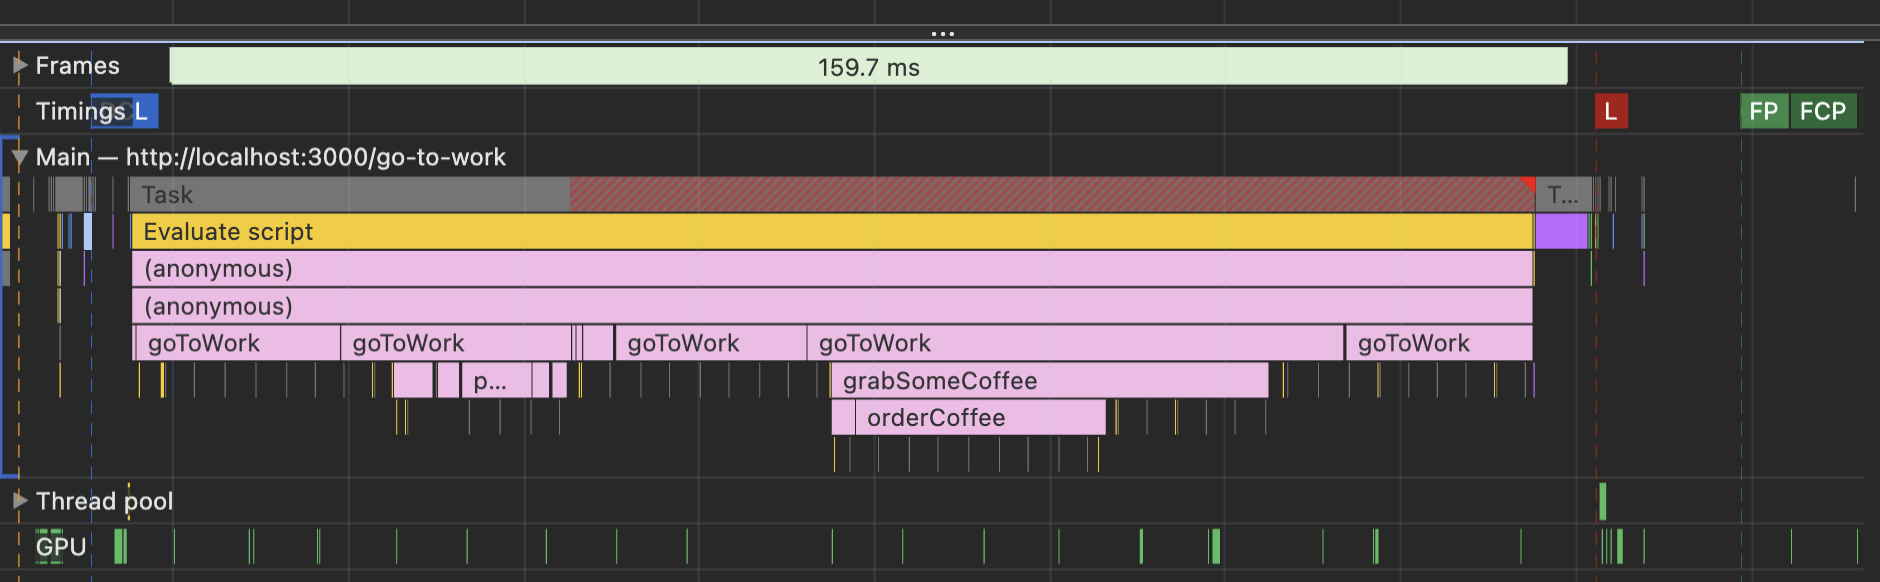
Okay, it slightly resembles the illustration above. That's because the script is run in the browser, and the profiler records everything that is happening - which is still a lot, even for the simplest script. But at least now we can read it and see that:
-
At first, there was the blue bar of "Parse HTML" - we know that one already. It happens when the HTML is received from the server. It triggered some JavaScript for some reason, but we don't care since it has nothing to do with our "walk to work" task. If you right-click on it and select "Hide children," we can even eliminate that visual distraction.
-
Then, there was a loooong yellow line of JavaScript. This is the script that implements the "go to work" functionality. That one triggers all of our functions, and their sequence looks pretty much like the pic above.
-
Only after the long yellow JavaScript line is done, the FCP/LCP metrics are triggered. This tells us that the metrics can happen only when both Parse HTML and the JavaScript tasks are done.
To confirm the latest assumption, we can take a look at the actual script and HTML page. You can find them in backend/assets in the study project.
The HTML looks something like this:
<html><head><script async src="./main.js"></script></head><body><div id="root"></div></body></html>
Very typical Client-Side rendering HTML. And in the script, at the very end, there is this:
const div = document.createElement('div');div.innerText = 'Arrived!';document.getElementById('root').appendChild(div);
After the synchronous function above is done, the JavaScript creates a DOM element and appends it to the existing <div> on the page. This corresponds really nicely with what's happening in the Flame Chart - until the JavaScript finished its work, there was no content on the page, so the FCP/LCP metrics couldn't be triggered.
What else is interesting here before we go back to the Flame Chart of an actual app?
First of all, there is a tiny purple block on the same line as the yellow JavaScript line. If you hover over it, you'll see that it's a "Layout" task.
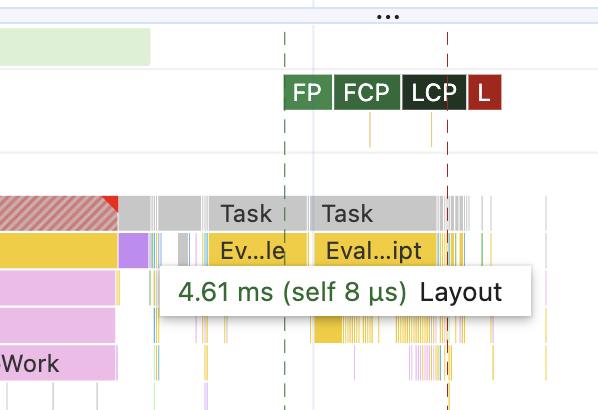
That one is quite important. This is where the browser calculates how the elements should be positioned on the screen and their exact dimensions. In this case, it's tiny since we're only adding one div to the page. But for large apps, it can be very visible.
Another important thing here is that all those lines are interactive. Clicking on any of them will update the detailed information in the tabs at the very bottom. Click on one of the "goToWork" bars, for example. In the "Summary" tab, there will be something like this:
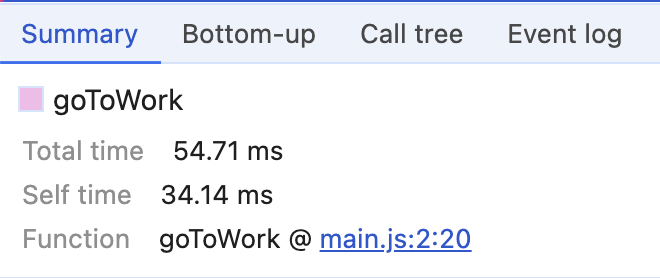
We found our "Total time" and "Self time". And more!
There is also the "Function" part here: this is what triggered this particular execution. Clicking on it will open the exact code where it started.
- Click on the "goToWork" block that produced the "petADog" function. Notice the Total and Self time.
- Click on the "petADog" block. Its total time should roughly match the difference between the Total and Self time in the block that produced it.
- Now click on the link in the "Function" block. It should navigate you to the exact file and the exact line where this function was called.
- Click on the yellow JavaScript line that produced the functions. Instead of "Function," it should have a "Script" there with a link to the script that produced that line.
Different blocks will have different information in the Summary tab.
This actually allows us to solve another mini-mystery of this graph: where are all those additional yellow JavaScript blocks coming from? The ones under the Parse HTML block and after our main "goToWork" task?
If you click through them, you should see their origin in the "Summary" tab in the "Script" part. All of them are various Chrome plugins! To see how much those plugins are messing with the performance graph (and the page performance in general), open the "Go to work" exercise in Chrome incognito mode and re-record the performance there.
For me, it looks like this now:
The "Parse HTML" task collapsed to oblivion. No more long-tail JavaScript tasks. The graph is so much clearer.
So this is a big lesson here: before doing anything with this graph, like panicking about the "Parse HTML" task being too long, make sure the outside influence, like third-party plugins, is eliminated.
Client-Side Rendering of a Real App in the Performance Panel
Now that we know how to read the Flame Chart, let's take another look at the chart of our semi-real Home page. This time, let's be smart and open it in "incognito" mode to get rid of all visual distractions. If you're on a very fast computer, it might also be helpful to enable "CPU slowdown" - this will make the bars longer and easier to read. It's in the same place where we configured Network throttling, so it's easy to find.
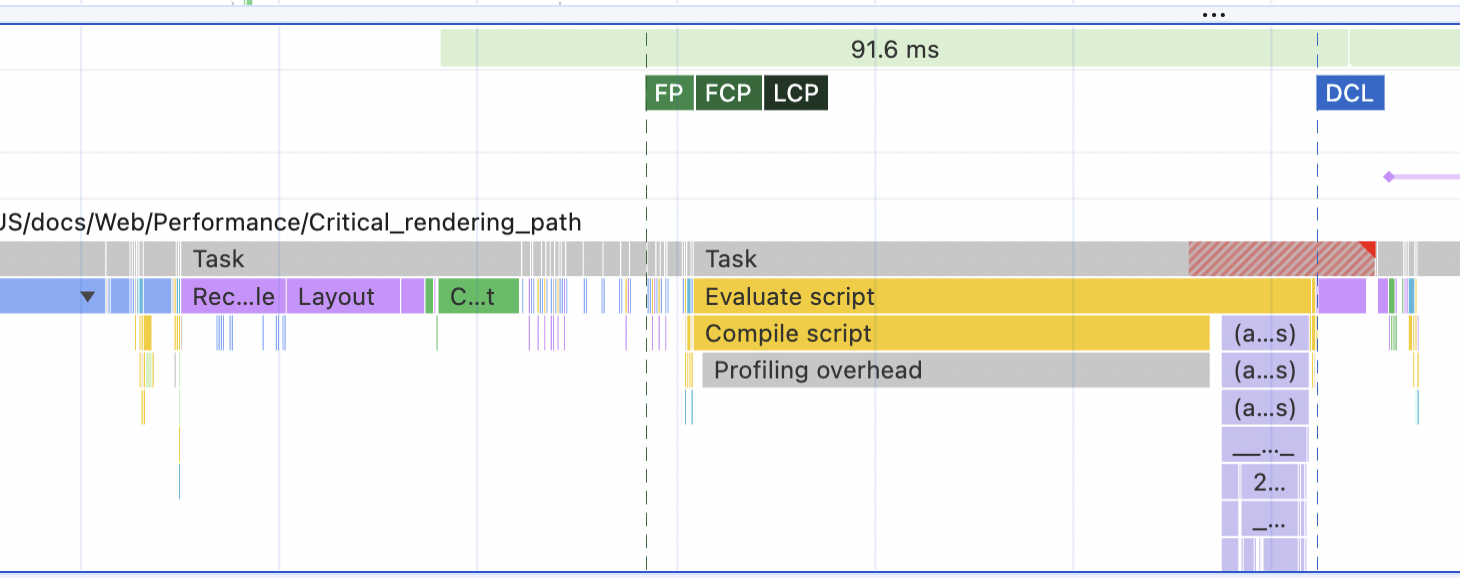
Can you read what's happening here now?
At first, there's "Parse HTML" again - the tiny blue bar at the very beginning. Then, there are two long yellow bars of JavaScript. Clicking on them shows us where they originated from - our index.js file with all the React stuff and the app I wrote.
Only after the JavaScript is done do the FCP/LCP metrics show up. That makes sense - the app uses Client-Side Rendering, so there's no content to trigger those metrics until the JS is done.
The "Layout" block is now huge and takes up almost a third of the second yellow JavaScript bar. That's because it's now the entire page, not just a tiny div like we had in the previous exercise. Also interesting is that the Layout is now part of the JavaScript bar - React triggered it synchronously.
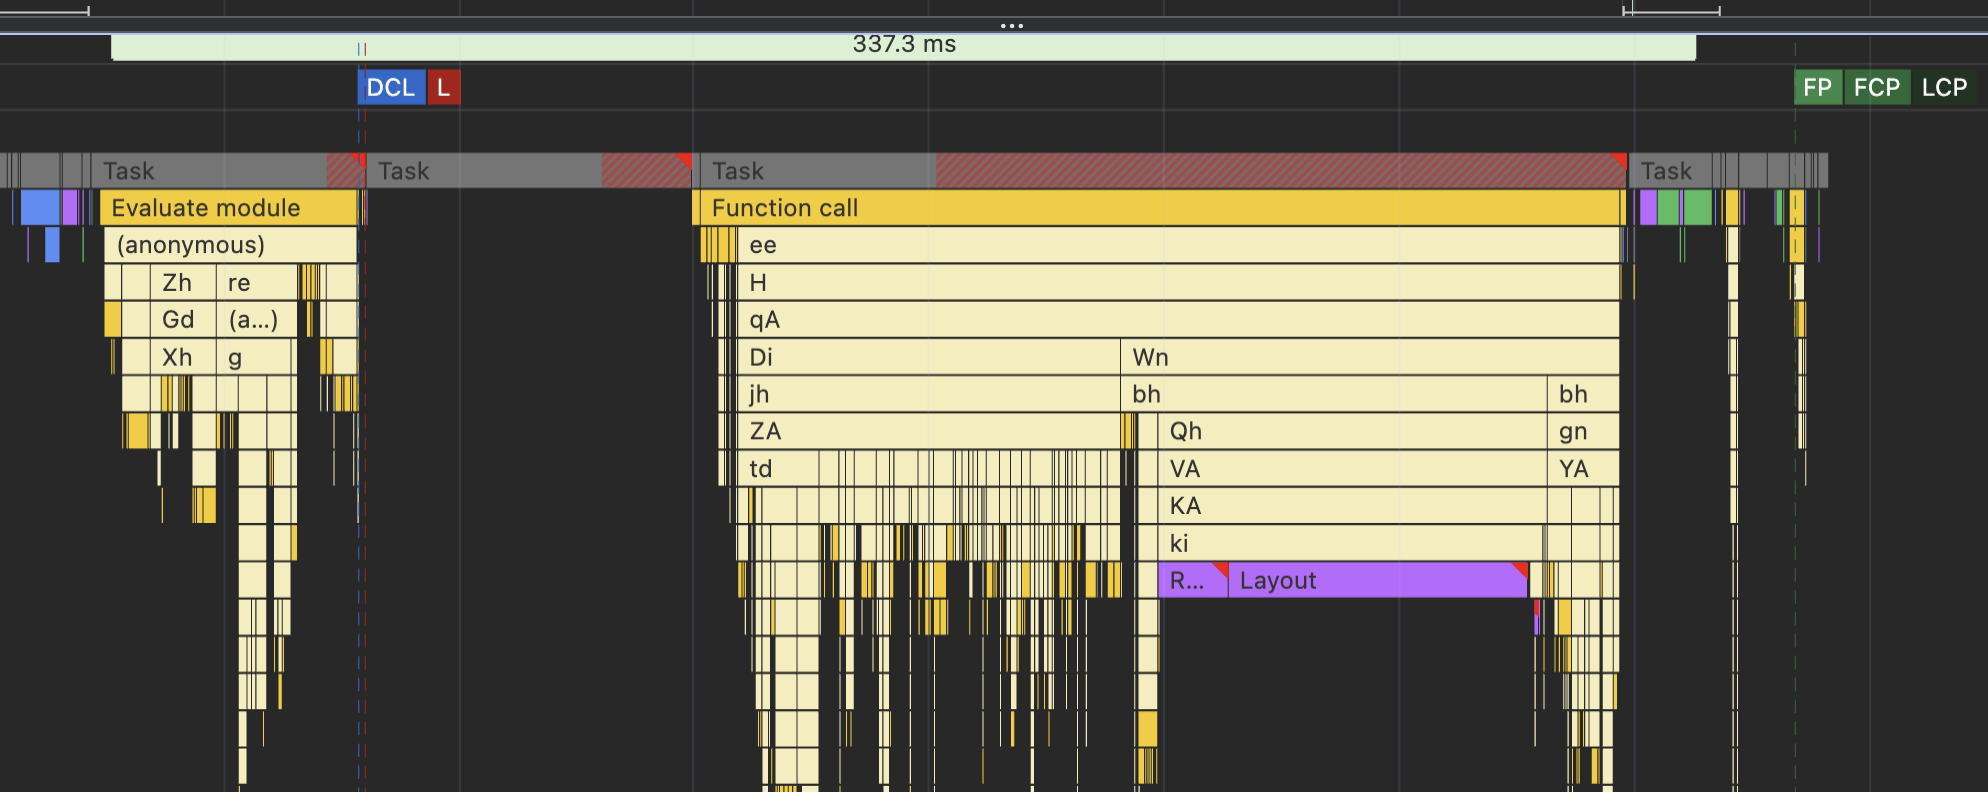
The fun part here comes from comparing this graph with a graph from a more traditional, non-client-side rendered website. Let's run it on any of the MDN pages, for example. The picture will be drastically different, almost in reverse:
As always, there's a blue "Parse HTML" at the beginning. But then, it's followed by a purple block of Layout right away and a green block of Painting (this is when the browser actually paints all the pixels of the calculated layout). We have the entire page of the MDN docs visible on the screen by this time, so FCP/LCP is triggered.
Only after that do I see a yellow JavaScript bar that does something. And somewhere far, far after the LCP is triggered, we see a DOMContentLoaded event (DCL) - this is when the browser is done parsing HTML and waiting for the scripts to load and execute.
So, what exactly was the point of looking at all of this, you might ask?
Because reading those graphs demonstrates very clearly the cost of doing Client-Side rendering:
- The initial load and LCP metric might suffer, even when the scripts are already downloaded and cached by the browser. We need to wait for their execution to see anything on a page.
- Without JavaScript, there will be no website at all, the user will just get a blank page. Try disabling JavaScript on the MDN page we used to measure performance and on the study project to see the difference.
Wait, this feels terrible! Why would anyone want to do Client-Side rendering then, considering those downsides?
First of all, because it's easy and cheap. Incredibly easy and cheap, to be precise. It's possible to build something complex and fully functional, serve it to thousands of users daily, and still pay zero dollars for hosting. Plus, no worries about scaling the system, outages, memory leaks, and all other "backend-y" stuff. The entire app is just a few static files that can be deployed pretty much anywhere without the need for any supervision. If the app is not concerned about "no JavaScript" environments, Client-Side rendering is great.
And second, and sometimes even more importantly, LCP and initial load are not the only things that matter when it comes to users and perceived performance. Sometimes, no one cares whether the app loads in 1 second, 1.2 seconds, or even 5 seconds, especially if there is some cute animation while the loading happens. Maybe the users came to the app not to look at it but to interact with it and are happy to wait for some initial loading time to get exceptional performance later. Plus, there are ways to minimize the initial load time even for Client-Side rendered apps.
Think of something like a project management software. No one goes there just to admire the view or to read poems (I hope). People open those apps to do some important daily tasks, which almost always involve lots and lots of interactions with the app.
In this case, smooth and very fast interactions and transitions between pages take priority over the initial load. Metrics like INP (Interaction to Next Paint) pop up, and the natural extension of Client-Side Rendering - SPA (Single-Page Applications) - begins to really shine.
But about this - another time.
Table of Contents
Want to learn even more?
Web Performance Fundamentals
A Frontend Developer’s Guide to Profile and Optimize React Web Apps

Advanced React
Deep dives, investigations, performance patterns and techniques.
Advanced React Mini-Course
Free YouTube mini-course following first seven chapters of the Advanced React book